

33 Analysis of Manufacturing Costs for Powder Metallurgy (PM) …
483
33.7.1 Gear Rolling Automation
The results in Table 33.2 (Sect. 33.5.1 ) show that gear rolling process’s automation
increases the equipment utilization and its operational cost. The equipment cost
during downtime and idle are increased as well, which can be realized due to setup
time, automation disturbances and preventive maintenances. However, the sensitivity
analysis’s outcomes indicate that higher automation cost, increases gear rolling cost
considerably and the total PM gear manufacturing cost marginally, in comparison to
the two other scenarios (see Table 33.2). Hence, the automation financially feasible
options, in this case study, is between the lower bound value and base case analysis
selected.
33.7.2 OEE Improvement
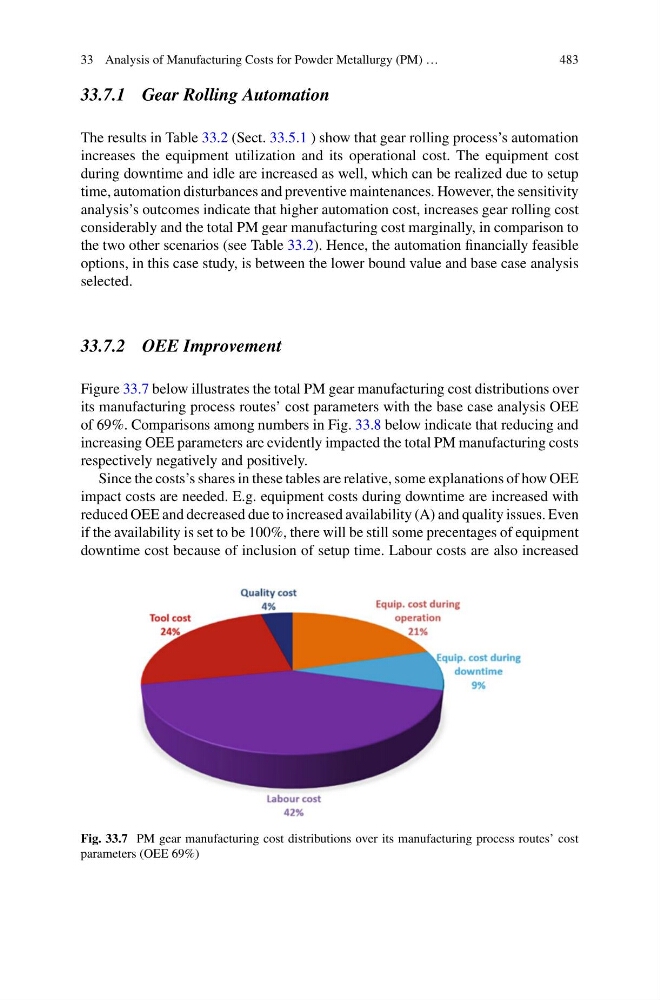
Figure 33.7 below illustrates the total PM gear manufacturing cost distributions over
its manufacturing process routes’ cost parameters with the base case analysis OEE
of 69%. Comparisons among numbers in Fig. 33.8 below indicate that reducing and
increasing OEE parameters are evidently impacted the total PM manufacturing costs
respectively negatively and positively.
Since the costs’s shares in these tables are relative, some explanations of how OEE
impact costs are needed. E.g. equipment costs during downtime are increased with
reduced OEE and decreased due to increased availability (A) and quality issues. Even
if the availability is set to be 100%, there will be still some precentages of equipment
downtime cost because of inclusion of setup time. Labour costs are also increased
Fig. 33.7 PM gear manufacturing cost distributions over its manufacturing process routes’ cost
parameters (OEE 69%)
483
33.7.1 Gear Rolling Automation
The results in Table 33.2 (Sect. 33.5.1 ) show that gear rolling process’s automation
increases the equipment utilization and its operational cost. The equipment cost
during downtime and idle are increased as well, which can be realized due to setup
time, automation disturbances and preventive maintenances. However, the sensitivity
analysis’s outcomes indicate that higher automation cost, increases gear rolling cost
considerably and the total PM gear manufacturing cost marginally, in comparison to
the two other scenarios (see Table 33.2). Hence, the automation financially feasible
options, in this case study, is between the lower bound value and base case analysis
selected.
33.7.2 OEE Improvement
Figure 33.7 below illustrates the total PM gear manufacturing cost distributions over
its manufacturing process routes’ cost parameters with the base case analysis OEE
of 69%. Comparisons among numbers in Fig. 33.8 below indicate that reducing and
increasing OEE parameters are evidently impacted the total PM manufacturing costs
respectively negatively and positively.
Since the costs’s shares in these tables are relative, some explanations of how OEE
impact costs are needed. E.g. equipment costs during downtime are increased with
reduced OEE and decreased due to increased availability (A) and quality issues. Even
if the availability is set to be 100%, there will be still some precentages of equipment
downtime cost because of inclusion of setup time. Labour costs are also increased
Fig. 33.7 PM gear manufacturing cost distributions over its manufacturing process routes’ cost
parameters (OEE 69%)