

480
B. Kianian and C. Andersson
P: 100%, Q: 98%). The practical OEE can in worst cases be as low as 40–50%.
For world-class manufacturing, OEE for non-process industry is reported to be in
the range of 85–92% previously (Bicheno 2004). For sensitivity analyses, the lower
bound value of 50% (A: 55%, P: 96%, Q: 95%) is selected for OEE, and in order to
assess the effect of an improved OEE on the PM gear manufacturing cost, the world
class OEE of 85% (A: 85%, P: 100%, Q: 99%) is selected as the upper bound value.
These OEE parameters percentages are assumed to be the same for all processing
routes in this case study’s analysis.
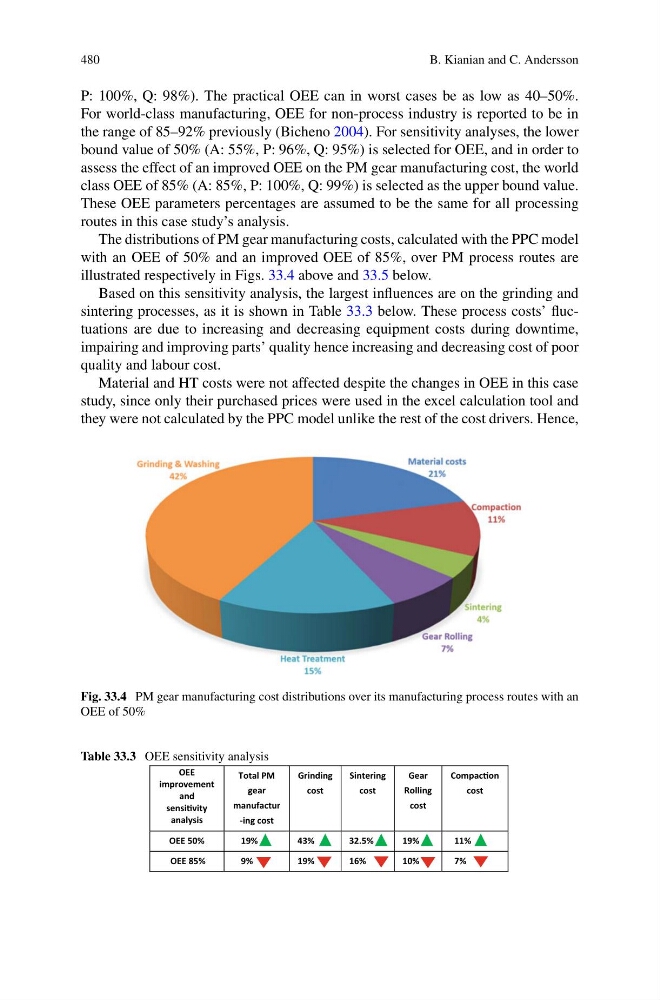
The distributions of PM gear manufacturing costs, calculated with the PPC model
with an OEE of 50% and an improved OEE of 85%, over PM process routes are
illustrated respectively in Figs. 33.4 above and 33.5 below.
Based on this sensitivity analysis, the largest influences are on the grinding and
sintering processes, as it is shown in Table 33.3 below. These process costs’ fluctuations are due to increasing and decreasing equipment costs during downtime,
impairing and improving parts’ quality hence increasing and decreasing cost of poor
quality and labour cost.
Material and HT costs were not affected despite the changes in OEE in this case
study, since only their purchased prices were used in the excel calculation tool and
they were not calculated by the PPC model unlike the rest of the cost drivers. Hence,
Fig. 33.4 PM gear manufacturing cost distributions over its manufacturing process routes with an
OEE of 50%
Table 33.3 OEE sensitivity analysis
OEE
improvement
and
sensiƟvity
analysis
Total PM
gear
manufactur
-ing cost
Grinding
cost
Sintering
cost
Gear
Rolling
cost
CompacƟon
cost
OEE 50%
19%
43%
32.5%
19%
11%
OEE 85%
9%
19%
16%
10%
7%
B. Kianian and C. Andersson
P: 100%, Q: 98%). The practical OEE can in worst cases be as low as 40–50%.
For world-class manufacturing, OEE for non-process industry is reported to be in
the range of 85–92% previously (Bicheno 2004). For sensitivity analyses, the lower
bound value of 50% (A: 55%, P: 96%, Q: 95%) is selected for OEE, and in order to
assess the effect of an improved OEE on the PM gear manufacturing cost, the world
class OEE of 85% (A: 85%, P: 100%, Q: 99%) is selected as the upper bound value.
These OEE parameters percentages are assumed to be the same for all processing
routes in this case study’s analysis.
The distributions of PM gear manufacturing costs, calculated with the PPC model
with an OEE of 50% and an improved OEE of 85%, over PM process routes are
illustrated respectively in Figs. 33.4 above and 33.5 below.
Based on this sensitivity analysis, the largest influences are on the grinding and
sintering processes, as it is shown in Table 33.3 below. These process costs’ fluctuations are due to increasing and decreasing equipment costs during downtime,
impairing and improving parts’ quality hence increasing and decreasing cost of poor
quality and labour cost.
Material and HT costs were not affected despite the changes in OEE in this case
study, since only their purchased prices were used in the excel calculation tool and
they were not calculated by the PPC model unlike the rest of the cost drivers. Hence,
Fig. 33.4 PM gear manufacturing cost distributions over its manufacturing process routes with an
OEE of 50%
Table 33.3 OEE sensitivity analysis
OEE
improvement
and
sensiƟvity
analysis
Total PM
gear
manufactur
-ing cost
Grinding
cost
Sintering
cost
Gear
Rolling
cost
CompacƟon
cost
OEE 50%
19%
43%
32.5%
19%
11%
OEE 85%
9%
19%
16%
10%
7%