

33 Analysis of Manufacturing Costs for Powder Metallurgy (PM) …
479
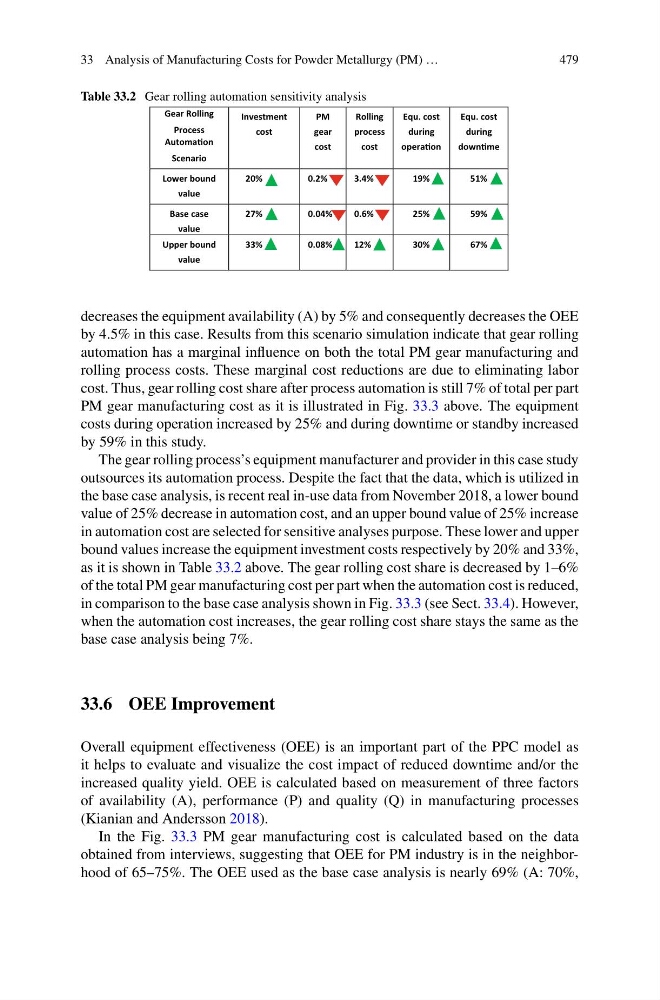
Table 33.2 Gear rolling automation sensitivity analysis
Gear Rolling
Process
AutomaƟon
Scenario
Investment
cost
PM
gear
cost
Rolling
process
cost
Equ. cost
during
operaƟon
Equ. cost
during
downƟme
Lower bound
value
Base case
value
Upper bound
value
20%
0.2%
3.4%
19%
51%
27%
0.04%
0.6%
25%
59%
33%
0.08%
12%
30%
67%
decreases the equipment availability (A) by 5% and consequently decreases the OEE
by 4.5% in this case. Results from this scenario simulation indicate that gear rolling
automation has a marginal influence on both the total PM gear manufacturing and
rolling process costs. These marginal cost reductions are due to eliminating labor
cost. Thus, gear rolling cost share after process automation is still 7% of total per part
PM gear manufacturing cost as it is illustrated in Fig. 33.3 above. The equipment
costs during operation increased by 25% and during downtime or standby increased
by 59% in this study.
The gear rolling process’s equipment manufacturer and provider in this case study
outsources its automation process. Despite the fact that the data, which is utilized in
the base case analysis, is recent real in-use data from November 2018, a lower bound
value of 25% decrease in automation cost, and an upper bound value of 25% increase
in automation cost are selected for sensitive analyses purpose. These lower and upper
bound values increase the equipment investment costs respectively by 20% and 33%,
as it is shown in Table 33.2 above. The gear rolling cost share is decreased by 1–6%
of the total PM gear manufacturing cost per part when the automation cost is reduced,
in comparison to the base case analysis shown in Fig. 33.3 (see Sect. 33.4). However,
when the automation cost increases, the gear rolling cost share stays the same as the
base case analysis being 7%.
33.6 OEE Improvement
Overall equipment effectiveness (OEE) is an important part of the PPC model as
it helps to evaluate and visualize the cost impact of reduced downtime and/or the
increased quality yield. OEE is calculated based on measurement of three factors
of availability (A), performance (P) and quality (Q) in manufacturing processes
(Kianian and Andersson 2018).
In the Fig. 33.3 PM gear manufacturing cost is calculated based on the data
obtained from interviews, suggesting that OEE for PM industry is in the neighborhood of 65–75%. The OEE used as the base case analysis is nearly 69% (A: 70%,
479
Table 33.2 Gear rolling automation sensitivity analysis
Gear Rolling
Process
AutomaƟon
Scenario
Investment
cost
PM
gear
cost
Rolling
process
cost
Equ. cost
during
operaƟon
Equ. cost
during
downƟme
Lower bound
value
Base case
value
Upper bound
value
20%
0.2%
3.4%
19%
51%
27%
0.04%
0.6%
25%
59%
33%
0.08%
12%
30%
67%
decreases the equipment availability (A) by 5% and consequently decreases the OEE
by 4.5% in this case. Results from this scenario simulation indicate that gear rolling
automation has a marginal influence on both the total PM gear manufacturing and
rolling process costs. These marginal cost reductions are due to eliminating labor
cost. Thus, gear rolling cost share after process automation is still 7% of total per part
PM gear manufacturing cost as it is illustrated in Fig. 33.3 above. The equipment
costs during operation increased by 25% and during downtime or standby increased
by 59% in this study.
The gear rolling process’s equipment manufacturer and provider in this case study
outsources its automation process. Despite the fact that the data, which is utilized in
the base case analysis, is recent real in-use data from November 2018, a lower bound
value of 25% decrease in automation cost, and an upper bound value of 25% increase
in automation cost are selected for sensitive analyses purpose. These lower and upper
bound values increase the equipment investment costs respectively by 20% and 33%,
as it is shown in Table 33.2 above. The gear rolling cost share is decreased by 1–6%
of the total PM gear manufacturing cost per part when the automation cost is reduced,
in comparison to the base case analysis shown in Fig. 33.3 (see Sect. 33.4). However,
when the automation cost increases, the gear rolling cost share stays the same as the
base case analysis being 7%.
33.6 OEE Improvement
Overall equipment effectiveness (OEE) is an important part of the PPC model as
it helps to evaluate and visualize the cost impact of reduced downtime and/or the
increased quality yield. OEE is calculated based on measurement of three factors
of availability (A), performance (P) and quality (Q) in manufacturing processes
(Kianian and Andersson 2018).
In the Fig. 33.3 PM gear manufacturing cost is calculated based on the data
obtained from interviews, suggesting that OEE for PM industry is in the neighborhood of 65–75%. The OEE used as the base case analysis is nearly 69% (A: 70%,