

27 An Economic Evaluation of Recycling System in Next-Generation …
391
27.4.2 Result of Scenario Analyzes
In this section explored what policies are effective for implementing a sustainable
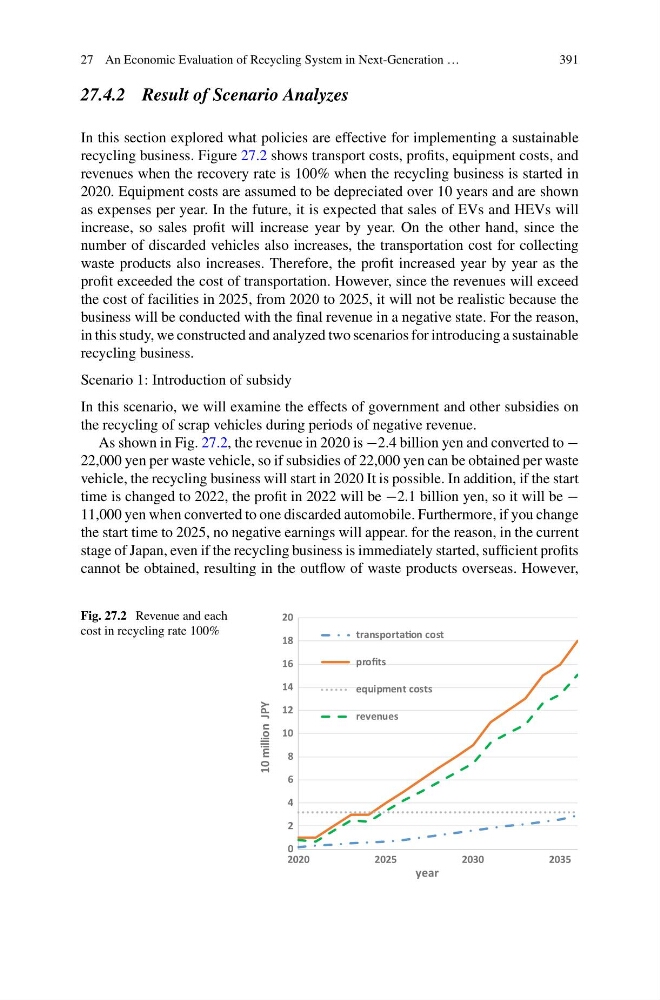
recycling business. Figure 27.2 shows transport costs, profits, equipment costs, and
revenues when the recovery rate is 100% when the recycling business is started in
2020. Equipment costs are assumed to be depreciated over 10 years and are shown
as expenses per year. In the future, it is expected that sales of EVs and HEVs will
increase, so sales profit will increase year by year. On the other hand, since the
number of discarded vehicles also increases, the transportation cost for collecting
waste products also increases. Therefore, the profit increased year by year as the
profit exceeded the cost of transportation. However, since the revenues will exceed
the cost of facilities in 2025, from 2020 to 2025, it will not be realistic because the
business will be conducted with the final revenue in a negative state. For the reason,
in this study, we constructed and analyzed two scenarios for introducing a sustainable
recycling business.
Scenario 1: Introduction of subsidy
In this scenario, we will examine the effects of government and other subsidies on
the recycling of scrap vehicles during periods of negative revenue.
As shown in Fig. 27.2, the revenue in 2020 is −2.4 billion yen and converted to −
22,000 yen per waste vehicle, so if subsidies of 22,000 yen can be obtained per waste
vehicle, the recycling business will start in 2020 It is possible. In addition, if the start
time is changed to 2022, the profit in 2022 will be −2.1 billion yen, so it will be −
11,000 yen when converted to one discarded automobile. Furthermore, if you change
the start time to 2025, no negative earnings will appear. for the reason, in the current
stage of Japan, even if the recycling business is immediately started, sufficient profits
cannot be obtained, resulting in the outflow of waste products overseas. However,
Fig. 27.2 Revenue and each
cost in recycling rate 100%
0
2
4
6
8
10
12
14
16
18
20
2020
2025
2030
2035
10 million JPY
year
transportaƟon cost
profits
equipment costs
revenues
391
27.4.2 Result of Scenario Analyzes
In this section explored what policies are effective for implementing a sustainable
recycling business. Figure 27.2 shows transport costs, profits, equipment costs, and
revenues when the recovery rate is 100% when the recycling business is started in
2020. Equipment costs are assumed to be depreciated over 10 years and are shown
as expenses per year. In the future, it is expected that sales of EVs and HEVs will
increase, so sales profit will increase year by year. On the other hand, since the
number of discarded vehicles also increases, the transportation cost for collecting
waste products also increases. Therefore, the profit increased year by year as the
profit exceeded the cost of transportation. However, since the revenues will exceed
the cost of facilities in 2025, from 2020 to 2025, it will not be realistic because the
business will be conducted with the final revenue in a negative state. For the reason,
in this study, we constructed and analyzed two scenarios for introducing a sustainable
recycling business.
Scenario 1: Introduction of subsidy
In this scenario, we will examine the effects of government and other subsidies on
the recycling of scrap vehicles during periods of negative revenue.
As shown in Fig. 27.2, the revenue in 2020 is −2.4 billion yen and converted to −
22,000 yen per waste vehicle, so if subsidies of 22,000 yen can be obtained per waste
vehicle, the recycling business will start in 2020 It is possible. In addition, if the start
time is changed to 2022, the profit in 2022 will be −2.1 billion yen, so it will be −
11,000 yen when converted to one discarded automobile. Furthermore, if you change
the start time to 2025, no negative earnings will appear. for the reason, in the current
stage of Japan, even if the recycling business is immediately started, sufficient profits
cannot be obtained, resulting in the outflow of waste products overseas. However,
Fig. 27.2 Revenue and each
cost in recycling rate 100%
0
2
4
6
8
10
12
14
16
18
20
2020
2025
2030
2035
10 million JPY
year
transportaƟon cost
profits
equipment costs
revenues