

390
H. Kuroki et al.
capacity and the partial circulation route. Constraint (11) shows that the number of
trucks passing through recycling facilities and dismantling facilities. Constraint (12)
specifies the binary variables.
27.4 Result and Discussion
27.4.1 Experiment Condition
The analysis period be from 2020 to 2040, and decide the optimum location of
the recycling facilities by solving location routing plan. Also, the candidate site for
dismantling facilities J and recycling facilities I will be the prefecture of Japan (I =
J = 46).
However, Okinawa Prefecture is excluded on the ground road connection. The
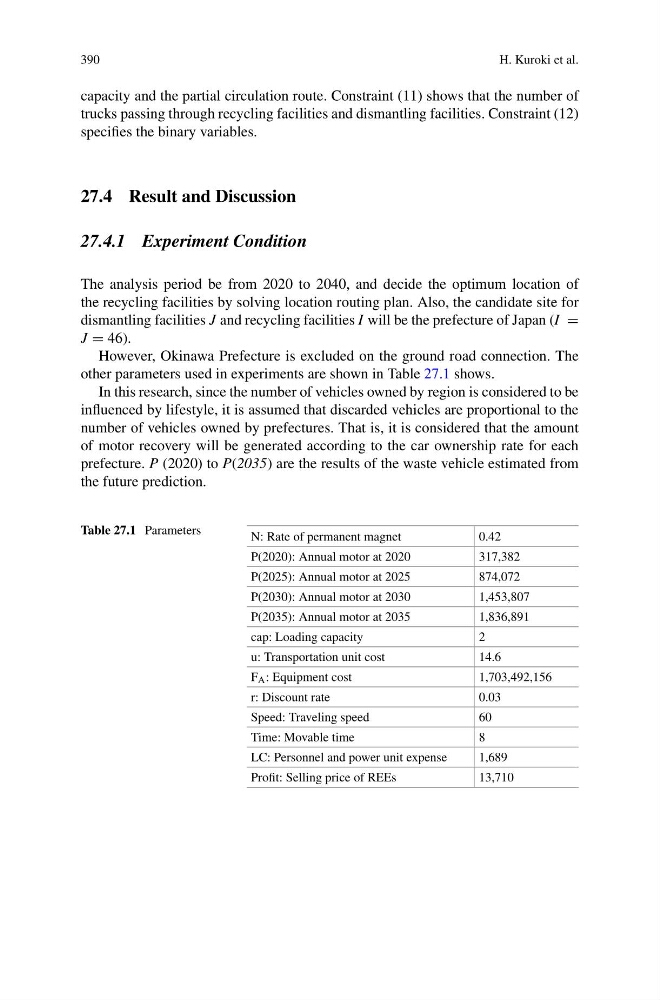
other parameters used in experiments are shown in Table 27.1 shows.
In this research, since the number of vehicles owned by region is considered to be
influenced by lifestyle, it is assumed that discarded vehicles are proportional to the
number of vehicles owned by prefectures. That is, it is considered that the amount
of motor recovery will be generated according to the car ownership rate for each
prefecture. P (2020) to P(2035) are the results of the waste vehicle estimated from
the future prediction.
Table 27.1 Parameters
N: Rate of permanent magnet
0.42
P(2020): Annual motor at 2020
317,382
P(2025): Annual motor at 2025
874,072
P(2030): Annual motor at 2030
1,453,807
P(2035): Annual motor at 2035
1,836,891
cap: Loading capacity
2
u: Transportation unit cost
14.6
F A : Equipment cost
1,703,492,156
r: Discount rate
0.03
Speed: Traveling speed
60
Time: Movable time
8
LC: Personnel and power unit expense
1,689
Profit: Selling price of REEs
13,710
H. Kuroki et al.
capacity and the partial circulation route. Constraint (11) shows that the number of
trucks passing through recycling facilities and dismantling facilities. Constraint (12)
specifies the binary variables.
27.4 Result and Discussion
27.4.1 Experiment Condition
The analysis period be from 2020 to 2040, and decide the optimum location of
the recycling facilities by solving location routing plan. Also, the candidate site for
dismantling facilities J and recycling facilities I will be the prefecture of Japan (I =
J = 46).
However, Okinawa Prefecture is excluded on the ground road connection. The
other parameters used in experiments are shown in Table 27.1 shows.
In this research, since the number of vehicles owned by region is considered to be
influenced by lifestyle, it is assumed that discarded vehicles are proportional to the
number of vehicles owned by prefectures. That is, it is considered that the amount
of motor recovery will be generated according to the car ownership rate for each
prefecture. P (2020) to P(2035) are the results of the waste vehicle estimated from
the future prediction.
Table 27.1 Parameters
N: Rate of permanent magnet
0.42
P(2020): Annual motor at 2020
317,382
P(2025): Annual motor at 2025
874,072
P(2030): Annual motor at 2030
1,453,807
P(2035): Annual motor at 2035
1,836,891
cap: Loading capacity
2
u: Transportation unit cost
14.6
F A : Equipment cost
1,703,492,156
r: Discount rate
0.03
Speed: Traveling speed
60
Time: Movable time
8
LC: Personnel and power unit expense
1,689
Profit: Selling price of REEs
13,710