

24 Life Cycle Simulation of Machine Parts with Part Agents
343
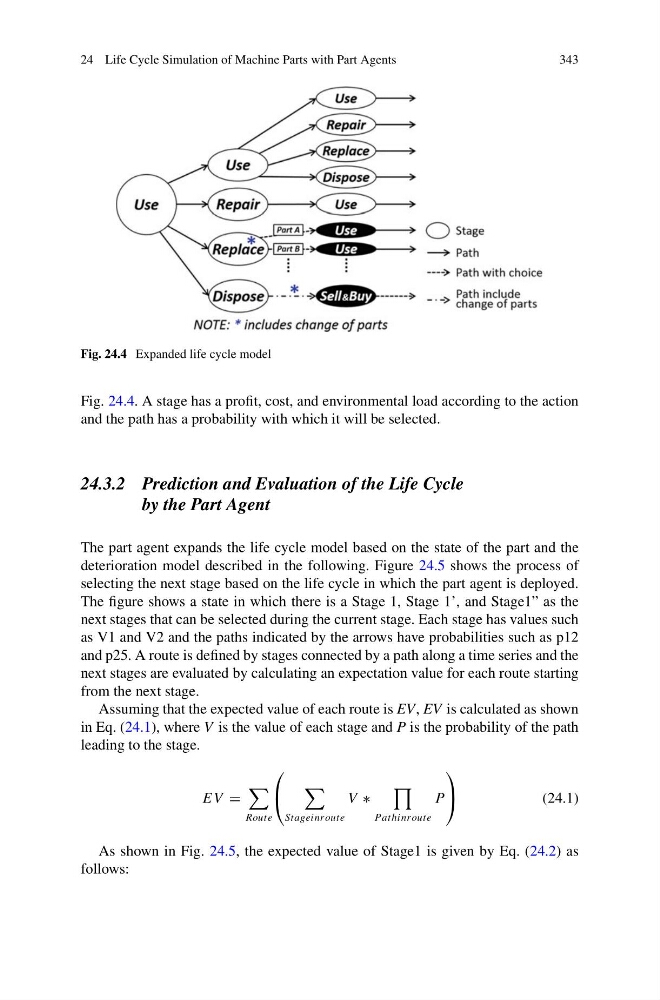
Fig. 24.4 Expanded life cycle model
Fig. 24.4. A stage has a profit, cost, and environmental load according to the action
and the path has a probability with which it will be selected.
24.3.2 Prediction and Evaluation of the Life Cycle
by the Part Agent
The part agent expands the life cycle model based on the state of the part and the
deterioration model described in the following. Figure 24.5 shows the process of
selecting the next stage based on the life cycle in which the part agent is deployed.
The figure shows a state in which there is a Stage 1, Stage 1’, and Stage1” as the
next stages that can be selected during the current stage. Each stage has values such
as V1 and V2 and the paths indicated by the arrows have probabilities such as p12
and p25. A route is defined by stages connected by a path along a time series and the
next stages are evaluated by calculating an expectation value for each route starting
from the next stage.
Assuming that the expected value of each route is EV, EV is calculated as shown
in Eq. (24.1), where V is the value of each stage and P is the probability of the path
leading to the stage.
E V =
Route
⎛
⎝
Stageinroute
V ∗
Pathinroute
P
⎞
⎠
(24.1)
As shown in Fig. 24.5, the expected value of Stage1 is given by Eq. (24.2) as
follows:
343
Fig. 24.4 Expanded life cycle model
Fig. 24.4. A stage has a profit, cost, and environmental load according to the action
and the path has a probability with which it will be selected.
24.3.2 Prediction and Evaluation of the Life Cycle
by the Part Agent
The part agent expands the life cycle model based on the state of the part and the
deterioration model described in the following. Figure 24.5 shows the process of
selecting the next stage based on the life cycle in which the part agent is deployed.
The figure shows a state in which there is a Stage 1, Stage 1’, and Stage1” as the
next stages that can be selected during the current stage. Each stage has values such
as V1 and V2 and the paths indicated by the arrows have probabilities such as p12
and p25. A route is defined by stages connected by a path along a time series and the
next stages are evaluated by calculating an expectation value for each route starting
from the next stage.
Assuming that the expected value of each route is EV, EV is calculated as shown
in Eq. (24.1), where V is the value of each stage and P is the probability of the path
leading to the stage.
E V =
Route
⎛
⎝
Stageinroute
V ∗
Pathinroute
P
⎞
⎠
(24.1)
As shown in Fig. 24.5, the expected value of Stage1 is given by Eq. (24.2) as
follows: