

332
T. Nagahata et al.
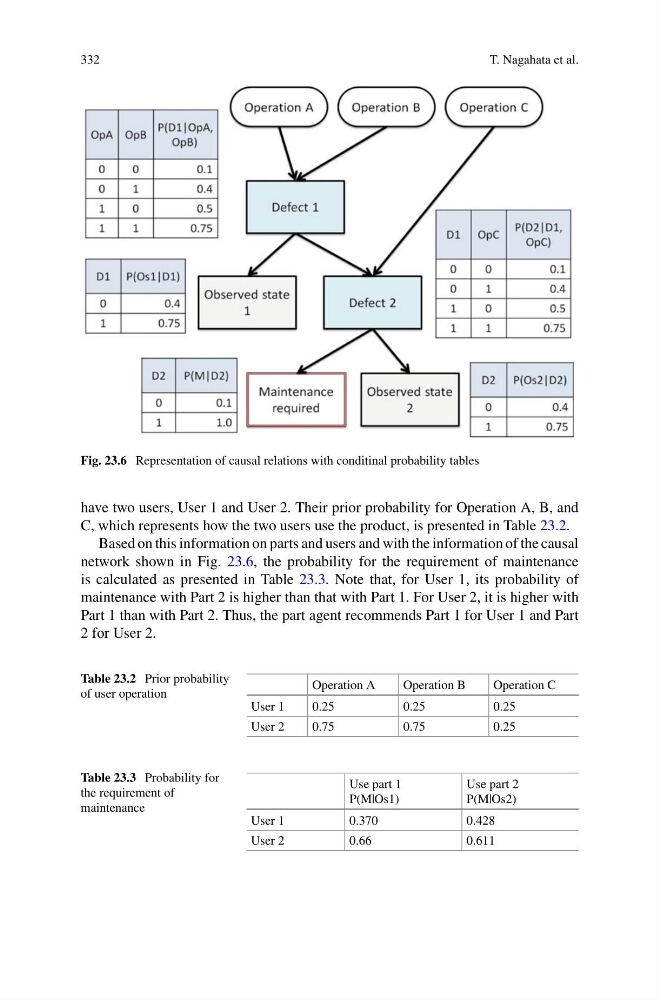
Fig. 23.6 Representation of causal relations with conditinal probability tables
have two users, User 1 and User 2. Their prior probability for Operation A, B, and
C, which represents how the two users use the product, is presented in Table 23.2.
Based on this information on parts and users and with the information of the causal
network shown in Fig. 23.6, the probability for the requirement of maintenance
is calculated as presented in Table 23.3. Note that, for User 1, its probability of
maintenance with Part 2 is higher than that with Part 1. For User 2, it is higher with
Part 1 than with Part 2. Thus, the part agent recommends Part 1 for User 1 and Part
2 for User 2.
Table 23.2 Prior probability
of user operation
Operation A
Operation B
Operation C
User 1
0.25
0.25
0.25
User 2
0.75
0.75
0.25
Table 23.3 Probability for
the requirement of
maintenance
Use part 1
P(M|Os1)
Use part 2
P(M|Os2)
User 1
0.370
0.428
User 2
0.66
0.611
T. Nagahata et al.
Fig. 23.6 Representation of causal relations with conditinal probability tables
have two users, User 1 and User 2. Their prior probability for Operation A, B, and
C, which represents how the two users use the product, is presented in Table 23.2.
Based on this information on parts and users and with the information of the causal
network shown in Fig. 23.6, the probability for the requirement of maintenance
is calculated as presented in Table 23.3. Note that, for User 1, its probability of
maintenance with Part 2 is higher than that with Part 1. For User 2, it is higher with
Part 1 than with Part 2. Thus, the part agent recommends Part 1 for User 1 and Part
2 for User 2.
Table 23.2 Prior probability
of user operation
Operation A
Operation B
Operation C
User 1
0.25
0.25
0.25
User 2
0.75
0.75
0.25
Table 23.3 Probability for
the requirement of
maintenance
Use part 1
P(M|Os1)
Use part 2
P(M|Os2)
User 1
0.370
0.428
User 2
0.66
0.611