

23 Application of Causality Model to Propose Maintenance …
331
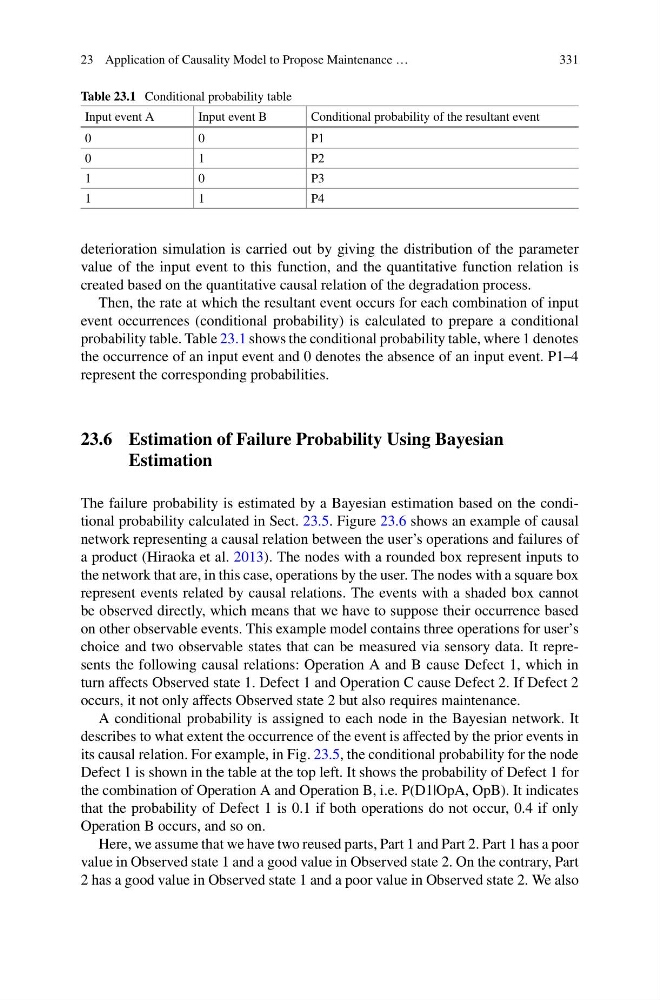
Table 23.1 Conditional probability table
Input event A
Input event B
Conditional probability of the resultant event
0
0
P1
0
1
P2
1
0
P3
1
1
P4
deterioration simulation is carried out by giving the distribution of the parameter
value of the input event to this function, and the quantitative function relation is
created based on the quantitative causal relation of the degradation process.
Then, the rate at which the resultant event occurs for each combination of input
event occurrences (conditional probability) is calculated to prepare a conditional
probability table. Table 23.1 shows the conditional probability table, where 1 denotes
the occurrence of an input event and 0 denotes the absence of an input event. P1–4
represent the corresponding probabilities.
23.6 Estimation of Failure Probability Using Bayesian
Estimation
The failure probability is estimated by a Bayesian estimation based on the conditional probability calculated in Sect. 23.5. Figure 23.6 shows an example of causal
network representing a causal relation between the user’s operations and failures of
a product (Hiraoka et al. 2013). The nodes with a rounded box represent inputs to
the network that are, in this case, operations by the user. The nodes with a square box
represent events related by causal relations. The events with a shaded box cannot
be observed directly, which means that we have to suppose their occurrence based
on other observable events. This example model contains three operations for user’s
choice and two observable states that can be measured via sensory data. It represents the following causal relations: Operation A and B cause Defect 1, which in
turn affects Observed state 1. Defect 1 and Operation C cause Defect 2. If Defect 2
occurs, it not only affects Observed state 2 but also requires maintenance.
A conditional probability is assigned to each node in the Bayesian network. It
describes to what extent the occurrence of the event is affected by the prior events in
its causal relation. For example, in Fig. 23.5, the conditional probability for the node
Defect 1 is shown in the table at the top left. It shows the probability of Defect 1 for
the combination of Operation A and Operation B, i.e. P(D1|OpA, OpB). It indicates
that the probability of Defect 1 is 0.1 if both operations do not occur, 0.4 if only
Operation B occurs, and so on.
Here, we assume that we have two reused parts, Part 1 and Part 2. Part 1 has a poor
value in Observed state 1 and a good value in Observed state 2. On the contrary, Part
2 has a good value in Observed state 1 and a poor value in Observed state 2. We also
331
Table 23.1 Conditional probability table
Input event A
Input event B
Conditional probability of the resultant event
0
0
P1
0
1
P2
1
0
P3
1
1
P4
deterioration simulation is carried out by giving the distribution of the parameter
value of the input event to this function, and the quantitative function relation is
created based on the quantitative causal relation of the degradation process.
Then, the rate at which the resultant event occurs for each combination of input
event occurrences (conditional probability) is calculated to prepare a conditional
probability table. Table 23.1 shows the conditional probability table, where 1 denotes
the occurrence of an input event and 0 denotes the absence of an input event. P1–4
represent the corresponding probabilities.
23.6 Estimation of Failure Probability Using Bayesian
Estimation
The failure probability is estimated by a Bayesian estimation based on the conditional probability calculated in Sect. 23.5. Figure 23.6 shows an example of causal
network representing a causal relation between the user’s operations and failures of
a product (Hiraoka et al. 2013). The nodes with a rounded box represent inputs to
the network that are, in this case, operations by the user. The nodes with a square box
represent events related by causal relations. The events with a shaded box cannot
be observed directly, which means that we have to suppose their occurrence based
on other observable events. This example model contains three operations for user’s
choice and two observable states that can be measured via sensory data. It represents the following causal relations: Operation A and B cause Defect 1, which in
turn affects Observed state 1. Defect 1 and Operation C cause Defect 2. If Defect 2
occurs, it not only affects Observed state 2 but also requires maintenance.
A conditional probability is assigned to each node in the Bayesian network. It
describes to what extent the occurrence of the event is affected by the prior events in
its causal relation. For example, in Fig. 23.5, the conditional probability for the node
Defect 1 is shown in the table at the top left. It shows the probability of Defect 1 for
the combination of Operation A and Operation B, i.e. P(D1|OpA, OpB). It indicates
that the probability of Defect 1 is 0.1 if both operations do not occur, 0.4 if only
Operation B occurs, and so on.
Here, we assume that we have two reused parts, Part 1 and Part 2. Part 1 has a poor
value in Observed state 1 and a good value in Observed state 2. On the contrary, Part
2 has a good value in Observed state 1 and a poor value in Observed state 2. We also