

23 Application of Causality Model to Propose Maintenance …
333
Thus, the combination of the input event pattern and the part state changes the
probability of occurrence of a failure event. It is possible to propose a more suitable
maintenance action by estimating the failure probability.
23.7 Life Cycle Simulation
The part agent predicts the future state of the part and proposes the maintenance of
that part to the user. Therefore, the part agent carries out an LCS on the basis of
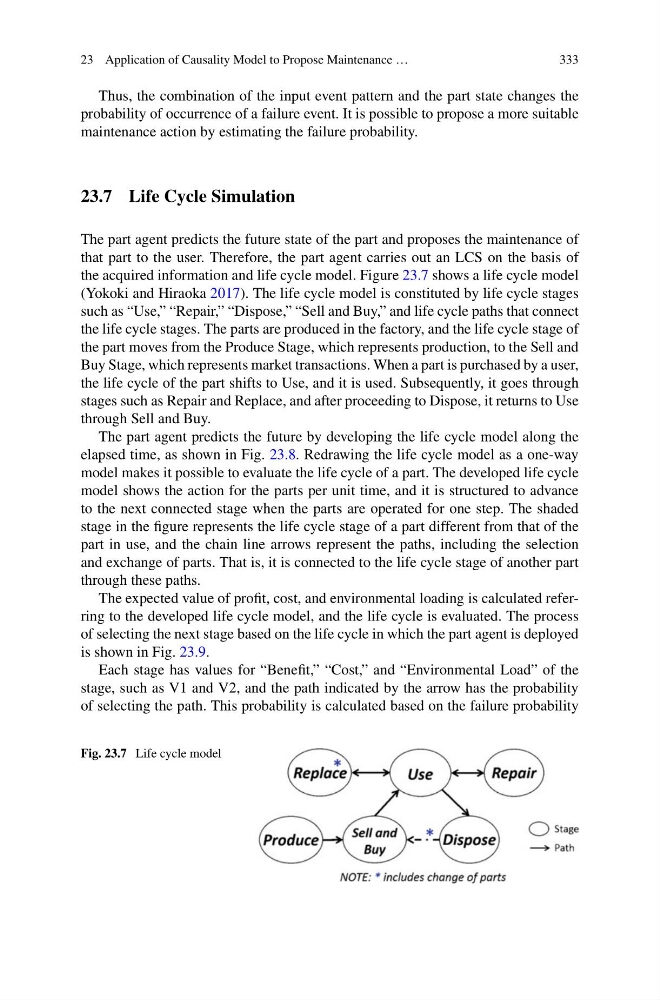
the acquired information and life cycle model. Figure 23.7 shows a life cycle model
(Yokoki and Hiraoka 2017). The life cycle model is constituted by life cycle stages
such as “Use,” “Repair,” “Dispose,” “Sell and Buy,” and life cycle paths that connect
the life cycle stages. The parts are produced in the factory, and the life cycle stage of
the part moves from the Produce Stage, which represents production, to the Sell and
Buy Stage, which represents market transactions. When a part is purchased by a user,
the life cycle of the part shifts to Use, and it is used. Subsequently, it goes through
stages such as Repair and Replace, and after proceeding to Dispose, it returns to Use
through Sell and Buy.
The part agent predicts the future by developing the life cycle model along the
elapsed time, as shown in Fig. 23.8. Redrawing the life cycle model as a one-way
model makes it possible to evaluate the life cycle of a part. The developed life cycle
model shows the action for the parts per unit time, and it is structured to advance
to the next connected stage when the parts are operated for one step. The shaded
stage in the figure represents the life cycle stage of a part different from that of the
part in use, and the chain line arrows represent the paths, including the selection
and exchange of parts. That is, it is connected to the life cycle stage of another part
through these paths.
The expected value of profit, cost, and environmental loading is calculated referring to the developed life cycle model, and the life cycle is evaluated. The process
of selecting the next stage based on the life cycle in which the part agent is deployed
is shown in Fig. 23.9.
Each stage has values for “Benefit,” “Cost,” and “Environmental Load” of the
stage, such as V1 and V2, and the path indicated by the arrow has the probability
of selecting the path. This probability is calculated based on the failure probability
Fig. 23.7 Life cycle model
333
Thus, the combination of the input event pattern and the part state changes the
probability of occurrence of a failure event. It is possible to propose a more suitable
maintenance action by estimating the failure probability.
23.7 Life Cycle Simulation
The part agent predicts the future state of the part and proposes the maintenance of
that part to the user. Therefore, the part agent carries out an LCS on the basis of
the acquired information and life cycle model. Figure 23.7 shows a life cycle model
(Yokoki and Hiraoka 2017). The life cycle model is constituted by life cycle stages
such as “Use,” “Repair,” “Dispose,” “Sell and Buy,” and life cycle paths that connect
the life cycle stages. The parts are produced in the factory, and the life cycle stage of
the part moves from the Produce Stage, which represents production, to the Sell and
Buy Stage, which represents market transactions. When a part is purchased by a user,
the life cycle of the part shifts to Use, and it is used. Subsequently, it goes through
stages such as Repair and Replace, and after proceeding to Dispose, it returns to Use
through Sell and Buy.
The part agent predicts the future by developing the life cycle model along the
elapsed time, as shown in Fig. 23.8. Redrawing the life cycle model as a one-way
model makes it possible to evaluate the life cycle of a part. The developed life cycle
model shows the action for the parts per unit time, and it is structured to advance
to the next connected stage when the parts are operated for one step. The shaded
stage in the figure represents the life cycle stage of a part different from that of the
part in use, and the chain line arrows represent the paths, including the selection
and exchange of parts. That is, it is connected to the life cycle stage of another part
through these paths.
The expected value of profit, cost, and environmental loading is calculated referring to the developed life cycle model, and the life cycle is evaluated. The process
of selecting the next stage based on the life cycle in which the part agent is deployed
is shown in Fig. 23.9.
Each stage has values for “Benefit,” “Cost,” and “Environmental Load” of the
stage, such as V1 and V2, and the path indicated by the arrow has the probability
of selecting the path. This probability is calculated based on the failure probability
Fig. 23.7 Life cycle model