

21 Closed Loop Tolerance Engineering Modelling and Maturity …
301
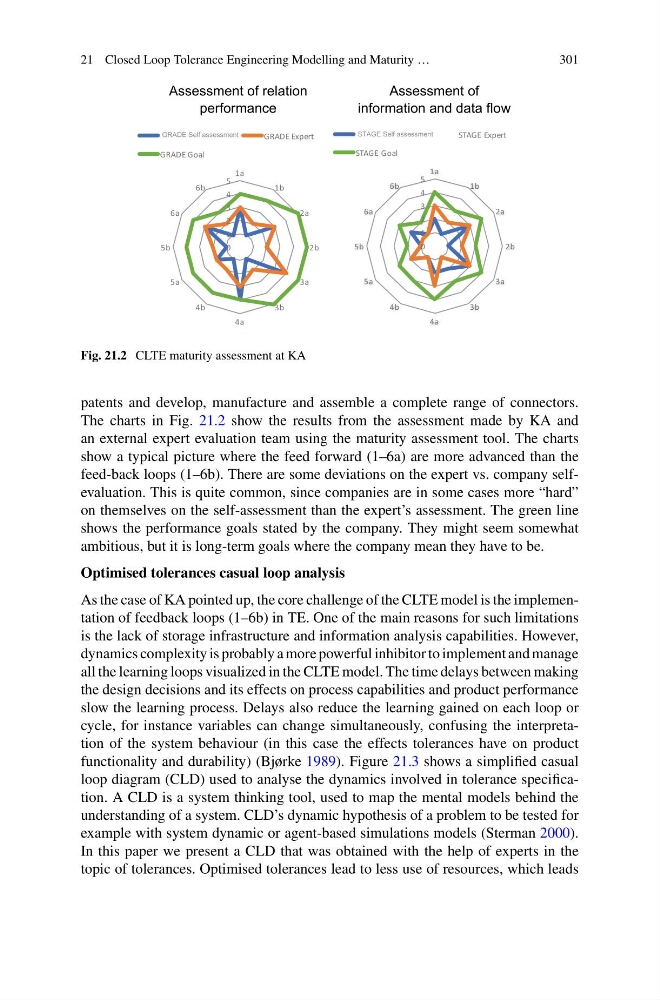
Fig. 21.2 CLTE maturity assessment at KA
patents and develop, manufacture and assemble a complete range of connectors.
The charts in Fig. 21.2 show the results from the assessment made by KA and
an external expert evaluation team using the maturity assessment tool. The charts
show a typical picture where the feed forward (1–6a) are more advanced than the
feed-back loops (1–6b). There are some deviations on the expert vs. company selfevaluation. This is quite common, since companies are in some cases more “hard”
on themselves on the self-assessment than the expert’s assessment. The green line
shows the performance goals stated by the company. They might seem somewhat
ambitious, but it is long-term goals where the company mean they have to be.
Optimised tolerances casual loop analysis
As the case of KA pointed up, the core challenge of the CLTE model is the implementation of feedback loops (1–6b) in TE. One of the main reasons for such limitations
is the lack of storage infrastructure and information analysis capabilities. However,
dynamics complexity is probably a more powerful inhibitor to implement and manage
all the learning loops visualized in the CLTE model. The time delays between making
the design decisions and its effects on process capabilities and product performance
slow the learning process. Delays also reduce the learning gained on each loop or
cycle, for instance variables can change simultaneously, confusing the interpretation of the system behaviour (in this case the effects tolerances have on product
functionality and durability) (Bjørke 1989). Figure 21.3 shows a simplified casual
loop diagram (CLD) used to analyse the dynamics involved in tolerance specification. A CLD is a system thinking tool, used to map the mental models behind the
understanding of a system. CLD’s dynamic hypothesis of a problem to be tested for
example with system dynamic or agent-based simulations models (Sterman 2000).
In this paper we present a CLD that was obtained with the help of experts in the
topic of tolerances. Optimised tolerances lead to less use of resources, which leads
301
Fig. 21.2 CLTE maturity assessment at KA
patents and develop, manufacture and assemble a complete range of connectors.
The charts in Fig. 21.2 show the results from the assessment made by KA and
an external expert evaluation team using the maturity assessment tool. The charts
show a typical picture where the feed forward (1–6a) are more advanced than the
feed-back loops (1–6b). There are some deviations on the expert vs. company selfevaluation. This is quite common, since companies are in some cases more “hard”
on themselves on the self-assessment than the expert’s assessment. The green line
shows the performance goals stated by the company. They might seem somewhat
ambitious, but it is long-term goals where the company mean they have to be.
Optimised tolerances casual loop analysis
As the case of KA pointed up, the core challenge of the CLTE model is the implementation of feedback loops (1–6b) in TE. One of the main reasons for such limitations
is the lack of storage infrastructure and information analysis capabilities. However,
dynamics complexity is probably a more powerful inhibitor to implement and manage
all the learning loops visualized in the CLTE model. The time delays between making
the design decisions and its effects on process capabilities and product performance
slow the learning process. Delays also reduce the learning gained on each loop or
cycle, for instance variables can change simultaneously, confusing the interpretation of the system behaviour (in this case the effects tolerances have on product
functionality and durability) (Bjørke 1989). Figure 21.3 shows a simplified casual
loop diagram (CLD) used to analyse the dynamics involved in tolerance specification. A CLD is a system thinking tool, used to map the mental models behind the
understanding of a system. CLD’s dynamic hypothesis of a problem to be tested for
example with system dynamic or agent-based simulations models (Sterman 2000).
In this paper we present a CLD that was obtained with the help of experts in the
topic of tolerances. Optimised tolerances lead to less use of resources, which leads