

15.2.2 Modelling Nutrient Stocks
Before proceeding to estimate nutrient stock model, it is necessary to know flow
sources that form negative or positive substance. Now, dynamic nutrient Eq. (15.2)
is rewritten as:
Z t ¼ 1 À δ
ð
ÞZ tÀ1 þ z t
ð15:3Þ
where z t ¼ ax t À by t is inferred as the nutrient balance. We adopted the methodology
of nutrient balance from the Organisation for Economic Co-operation and Development (OECD) and Eurostat (OECD 2007a; 2007b) for the present study, net nutrient
flow z t for period t can be written as:
z t ¼ α 1 FR t þ α 2 LM t þ α 3 BF t þ α 4 AD t
ð
Þ À β 1 CC t þ β 2 NCC t
ð
Þ
ð 15:4Þ
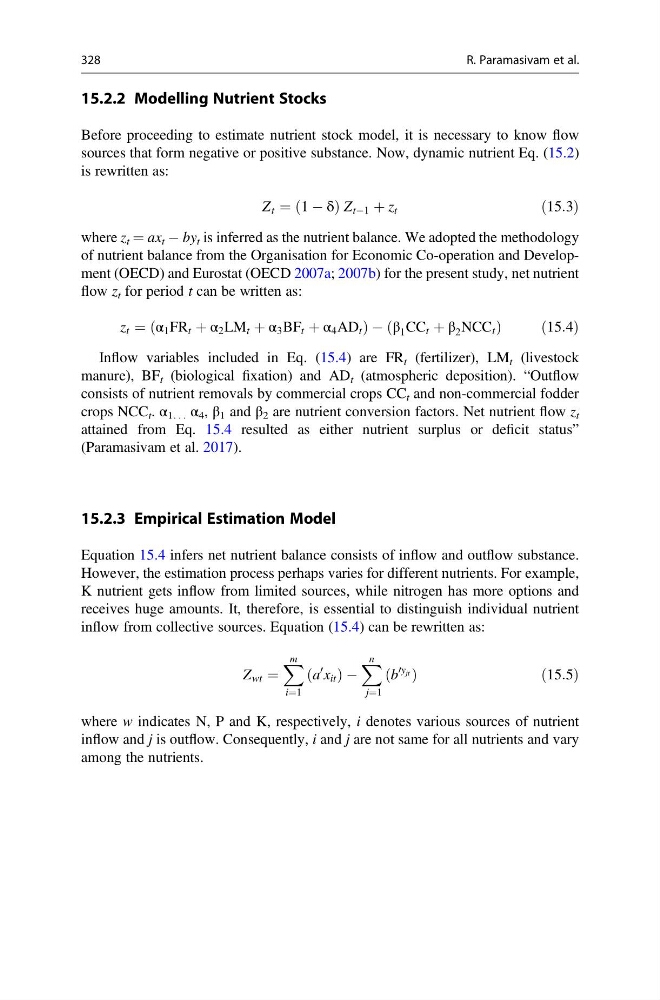
Inflow variables included in Eq. (15.4) are FR t (fertilizer), LM t (livestock
manure), BF t (biological fixation) and AD t (atmospheric deposition). “Outflow
consists of nutrient removals by commercial crops CC t and non-commercial fodder
crops NCC t . α 1. . . α 4 , β 1 and β 2 are nutrient conversion factors. Net nutrient flow z t
attained from Eq. 15.4 resulted as either nutrient surplus or deficit status”
(Paramasivam et al. 2017).
15.2.3 Empirical Estimation Model
Equation 15.4 infers net nutrient balance consists of inflow and outflow substance.
However, the estimation process perhaps varies for different nutrients. For example,
K nutrient gets inflow from limited sources, while nitrogen has more options and
receives huge amounts. It, therefore, is essential to distinguish individual nutrient
inflow from collective sources. Equation (15.4) can be rewritten as:
Z wt ¼
X m
i¼1
a
0
x it
ð
ÞÀ
X n
j¼1
b
0y jt
ð Þ
ð15:5Þ
where w indicates N, P and K, respectively, i denotes various sources of nutrient
inflow and j is outflow. Consequently, i and j are not same for all nutrients and vary
among the nutrients.
328
R. Paramasivam et al.
Before proceeding to estimate nutrient stock model, it is necessary to know flow
sources that form negative or positive substance. Now, dynamic nutrient Eq. (15.2)
is rewritten as:
Z t ¼ 1 À δ
ð
ÞZ tÀ1 þ z t
ð15:3Þ
where z t ¼ ax t À by t is inferred as the nutrient balance. We adopted the methodology
of nutrient balance from the Organisation for Economic Co-operation and Development (OECD) and Eurostat (OECD 2007a; 2007b) for the present study, net nutrient
flow z t for period t can be written as:
z t ¼ α 1 FR t þ α 2 LM t þ α 3 BF t þ α 4 AD t
ð
Þ À β 1 CC t þ β 2 NCC t
ð
Þ
ð 15:4Þ
Inflow variables included in Eq. (15.4) are FR t (fertilizer), LM t (livestock
manure), BF t (biological fixation) and AD t (atmospheric deposition). “Outflow
consists of nutrient removals by commercial crops CC t and non-commercial fodder
crops NCC t . α 1. . . α 4 , β 1 and β 2 are nutrient conversion factors. Net nutrient flow z t
attained from Eq. 15.4 resulted as either nutrient surplus or deficit status”
(Paramasivam et al. 2017).
15.2.3 Empirical Estimation Model
Equation 15.4 infers net nutrient balance consists of inflow and outflow substance.
However, the estimation process perhaps varies for different nutrients. For example,
K nutrient gets inflow from limited sources, while nitrogen has more options and
receives huge amounts. It, therefore, is essential to distinguish individual nutrient
inflow from collective sources. Equation (15.4) can be rewritten as:
Z wt ¼
X m
i¼1
a
0
x it
ð
ÞÀ
X n
j¼1
b
0y jt
ð Þ
ð15:5Þ
where w indicates N, P and K, respectively, i denotes various sources of nutrient
inflow and j is outflow. Consequently, i and j are not same for all nutrients and vary
among the nutrients.
328
R. Paramasivam et al.