

was intended to estimate the soil K balance in various regions of Tamil Nadu from
1990 to 2013 and also to estimate soil stock and removal of K per hectare in the
Tamil Nadu State.
15.2 Material and Methods
15.2.1 Dynamic Nutrient Balance Accounting
Nutrient budget or balance is a support for optimizing soil nutrient stock. Addition of
nutrients (flow sources) to soil has a significant effect on the determination of stock,
the flow substance (source) was represented by z (lowercase) and stock substance by
Z. We, initially, use static model to calculate yearly net substances, which meant
residual substance deducted from inflow–outflow substances. This is estimated by
using conventional material balance equation (Ayres and Kneese 1969).
z ¼ a
’
x À b
’
y
ð15:1Þ
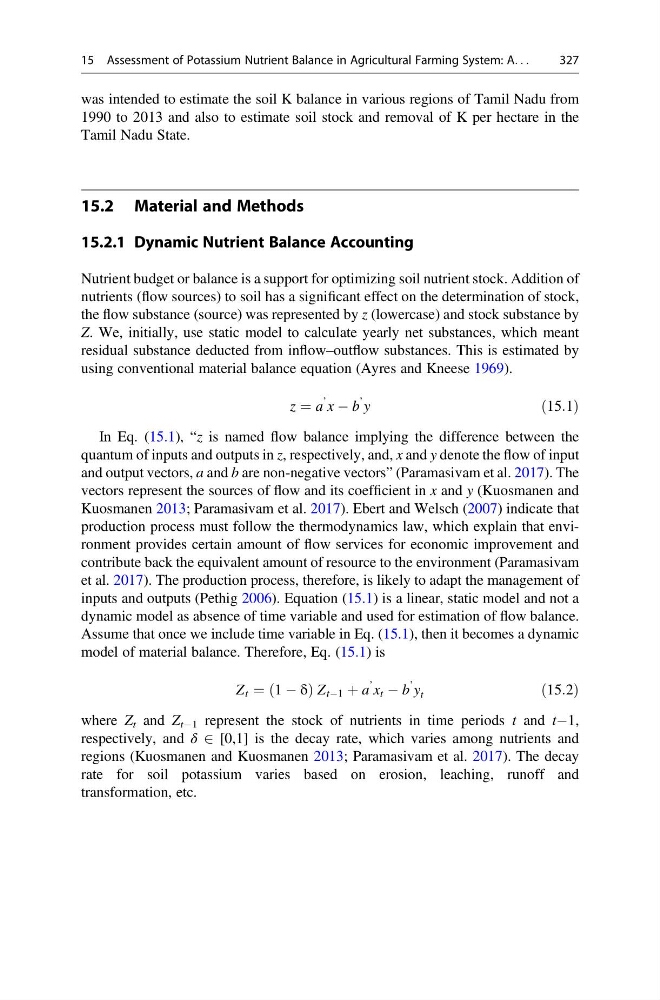
In Eq. (15.1), “z is named flow balance implying the difference between the
quantum of inputs and outputs in z, respectively, and, x and y denote the flow of input
and output vectors, a and b are non-negative vectors” (Paramasivam et al. 2017). The
vectors represent the sources of flow and its coefficient in x and y (Kuosmanen and
Kuosmanen 2013; Paramasivam et al. 2017). Ebert and Welsch (2007) indicate that
production process must follow the thermodynamics law, which explain that environment provides certain amount of flow services for economic improvement and
contribute back the equivalent amount of resource to the environment (Paramasivam
et al. 2017). The production process, therefore, is likely to adapt the management of
inputs and outputs (Pethig 2006). Equation (15.1) is a linear, static model and not a
dynamic model as absence of time variable and used for estimation of flow balance.
Assume that once we include time variable in Eq. (15.1), then it becomes a dynamic
model of material balance. Therefore, Eq. (15.1) is
Z t ¼ 1 À δ
ð
ÞZ tÀ1 þ a
’
x t À b
’
y t
ð15:2Þ
where Z t and Z tÀ1 represent the stock of nutrients in time periods t and tÀ1,
respectively, and δ 2 [0,1] is the decay rate, which varies among nutrients and
regions (Kuosmanen and Kuosmanen 2013; Paramasivam et al. 2017). The decay
rate for soil potassium varies based on erosion, leaching, runoff and
transformation, etc.
15 Assessment of Potassium Nutrient Balance in Agricultural Farming System: A. . .
327
1990 to 2013 and also to estimate soil stock and removal of K per hectare in the
Tamil Nadu State.
15.2 Material and Methods
15.2.1 Dynamic Nutrient Balance Accounting
Nutrient budget or balance is a support for optimizing soil nutrient stock. Addition of
nutrients (flow sources) to soil has a significant effect on the determination of stock,
the flow substance (source) was represented by z (lowercase) and stock substance by
Z. We, initially, use static model to calculate yearly net substances, which meant
residual substance deducted from inflow–outflow substances. This is estimated by
using conventional material balance equation (Ayres and Kneese 1969).
z ¼ a
’
x À b
’
y
ð15:1Þ
In Eq. (15.1), “z is named flow balance implying the difference between the
quantum of inputs and outputs in z, respectively, and, x and y denote the flow of input
and output vectors, a and b are non-negative vectors” (Paramasivam et al. 2017). The
vectors represent the sources of flow and its coefficient in x and y (Kuosmanen and
Kuosmanen 2013; Paramasivam et al. 2017). Ebert and Welsch (2007) indicate that
production process must follow the thermodynamics law, which explain that environment provides certain amount of flow services for economic improvement and
contribute back the equivalent amount of resource to the environment (Paramasivam
et al. 2017). The production process, therefore, is likely to adapt the management of
inputs and outputs (Pethig 2006). Equation (15.1) is a linear, static model and not a
dynamic model as absence of time variable and used for estimation of flow balance.
Assume that once we include time variable in Eq. (15.1), then it becomes a dynamic
model of material balance. Therefore, Eq. (15.1) is
Z t ¼ 1 À δ
ð
ÞZ tÀ1 þ a
’
x t À b
’
y t
ð15:2Þ
where Z t and Z tÀ1 represent the stock of nutrients in time periods t and tÀ1,
respectively, and δ 2 [0,1] is the decay rate, which varies among nutrients and
regions (Kuosmanen and Kuosmanen 2013; Paramasivam et al. 2017). The decay
rate for soil potassium varies based on erosion, leaching, runoff and
transformation, etc.
15 Assessment of Potassium Nutrient Balance in Agricultural Farming System: A. . .
327