

exposure. In other words, the exponential function of the regression coefficient (e
b1 )
is the odds ratio associated with a one-unit increase in the exposure. The 95%
confidence interval (CI) is used to estimate the precision of the odds ratio. A large
CI value indicates a low level of precision of the odds ratio, whereas a small CI value
indicates a higher precision of the odds ratio.
The following approach was used during focus group discussions:
Focus group discussions allowed researchers to obtain a wealth of in-depth
qualitative information, which was combined with the information obtained with
the quantitative method, to help explain the “why” or the “how” of observed
statistical trends. The results of the focus group interviews were combined with
the quantitative results in a way that is coherent and that supports the overall
findings, conclusions, and recommendations of the study. Three regional managers
and 52 Homestead Food Garden (HFG) advisors took part in the focus group
discussions. The presence of the HFG advisors made it possible to discuss issues
of operations and management of the food gardens, as well as their relationship with
households and the local councillors. The focus group method was chosen because
the HFG advisors knew the households very well and therefore it was envisaged that
they would be comfortable to share information about their relationship with these
households and issues that affect them as the department. The focus groups also
enabled the researcher to observe how government officials interact with one
another, how they perceived issues of food security and sustainable livelihoods,
and how these issues affect them as a department.
14.4 Results and Discussion
14.4.1 Study Area
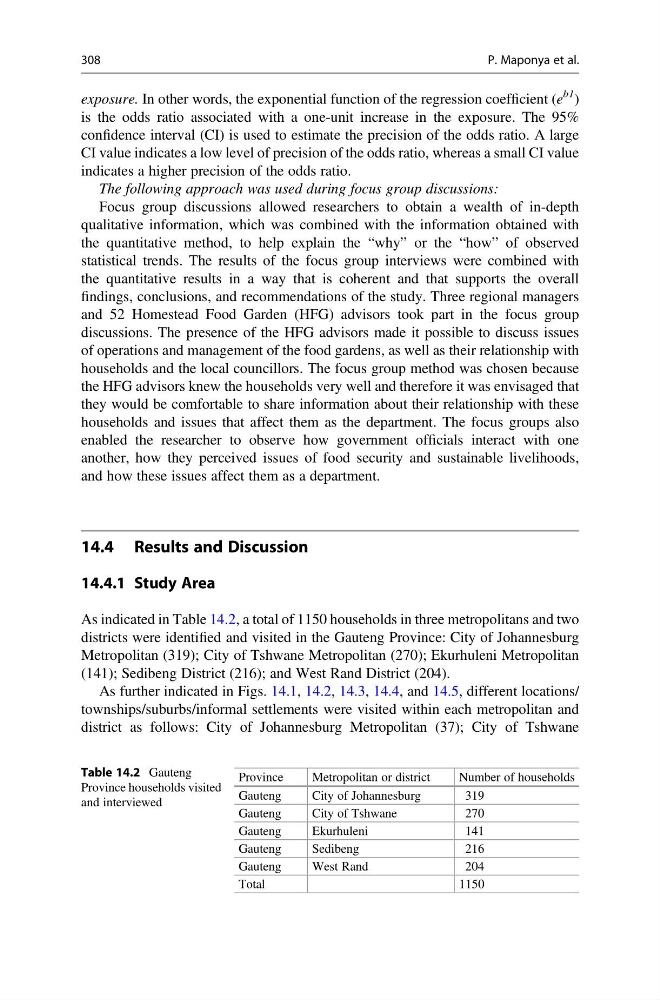
As indicated in Table 14.2, a total of 1150 households in three metropolitans and two
districts were identified and visited in the Gauteng Province: City of Johannesburg
Metropolitan (319); City of Tshwane Metropolitan (270); Ekurhuleni Metropolitan
(141); Sedibeng District (216); and West Rand District (204).
As further indicated in Figs. 14.1, 14.2, 14.3, 14.4, and 14.5, different locations/
townships/suburbs/informal settlements were visited within each metropolitan and
district as follows: City of Johannesburg Metropolitan (37); City of Tshwane
Table 14.2 Gauteng
Province households visited
and interviewed
Province
Metropolitan or district
Number of households
Gauteng
City of Johannesburg
319
Gauteng
City of Tshwane
270
Gauteng
Ekurhuleni
141
Gauteng
Sedibeng
216
Gauteng
West Rand
204
Total
1150
308
P. Maponya et al.
b1 )
is the odds ratio associated with a one-unit increase in the exposure. The 95%
confidence interval (CI) is used to estimate the precision of the odds ratio. A large
CI value indicates a low level of precision of the odds ratio, whereas a small CI value
indicates a higher precision of the odds ratio.
The following approach was used during focus group discussions:
Focus group discussions allowed researchers to obtain a wealth of in-depth
qualitative information, which was combined with the information obtained with
the quantitative method, to help explain the “why” or the “how” of observed
statistical trends. The results of the focus group interviews were combined with
the quantitative results in a way that is coherent and that supports the overall
findings, conclusions, and recommendations of the study. Three regional managers
and 52 Homestead Food Garden (HFG) advisors took part in the focus group
discussions. The presence of the HFG advisors made it possible to discuss issues
of operations and management of the food gardens, as well as their relationship with
households and the local councillors. The focus group method was chosen because
the HFG advisors knew the households very well and therefore it was envisaged that
they would be comfortable to share information about their relationship with these
households and issues that affect them as the department. The focus groups also
enabled the researcher to observe how government officials interact with one
another, how they perceived issues of food security and sustainable livelihoods,
and how these issues affect them as a department.
14.4 Results and Discussion
14.4.1 Study Area
As indicated in Table 14.2, a total of 1150 households in three metropolitans and two
districts were identified and visited in the Gauteng Province: City of Johannesburg
Metropolitan (319); City of Tshwane Metropolitan (270); Ekurhuleni Metropolitan
(141); Sedibeng District (216); and West Rand District (204).
As further indicated in Figs. 14.1, 14.2, 14.3, 14.4, and 14.5, different locations/
townships/suburbs/informal settlements were visited within each metropolitan and
district as follows: City of Johannesburg Metropolitan (37); City of Tshwane
Table 14.2 Gauteng
Province households visited
and interviewed
Province
Metropolitan or district
Number of households
Gauteng
City of Johannesburg
319
Gauteng
City of Tshwane
270
Gauteng
Ekurhuleni
141
Gauteng
Sedibeng
216
Gauteng
West Rand
204
Total
1150
308
P. Maponya et al.