

Wi ¼ þ Xi þ i
ð14:1Þ
where, Wi is the dependent variable value for person i. Xi is the independent variable
value for person i. _ and _ are parameter values. i is the random error term. The
parameter _ is called the intercept or the value of W when X ¼ 0. The parameter _ is
called the slope or the change in W when X increases by one.
The sample data variables predicted an 87% for Cox and Snell (measure for
binary logistics regression); 91% for McFadden (measure for multinomial and
ordered logit) variation in the dependent variable was explained by the independent
variables. Prediction accuracy was assessed based on the coefficient of determination
(R
2 ). The coefficient of determination R
2 was used to explain the total proportion of
variance in the dependent variable explained by the independent variable. The R
2
removes the influence of the independent variable not accounted for in the
constructs. R
2 is always between 0 and 100%. In general, the higher the R
2 value,
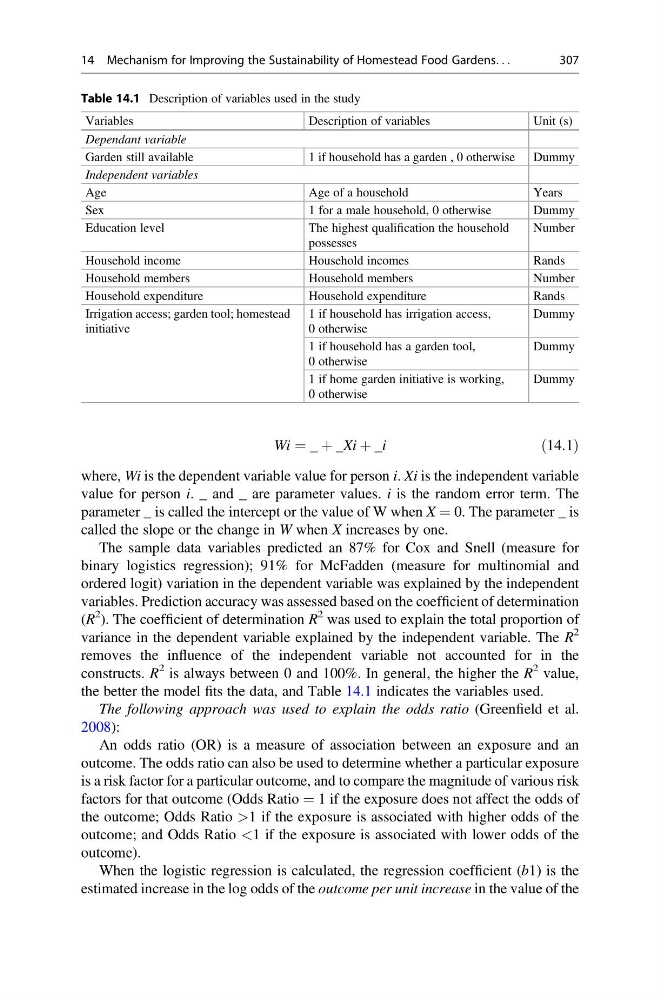
the better the model fits the data, and Table 14.1 indicates the variables used.
The following approach was used to explain the odds ratio (Greenfield et al.
2008):
An odds ratio (OR) is a measure of association between an exposure and an
outcome. The odds ratio can also be used to determine whether a particular exposure
is a risk factor for a particular outcome, and to compare the magnitude of various risk
factors for that outcome (Odds Ratio ¼ 1 if the exposure does not affect the odds of
the outcome; Odds Ratio >1 if the exposure is associated with higher odds of the
outcome; and Odds Ratio <1 if the exposure is associated with lower odds of the
outcome).
When the logistic regression is calculated, the regression coefficient (b1) is the
estimated increase in the log odds of the outcome per unit increase in the value of the
Table 14.1 Description of variables used in the study
Variables
Description of variables
Unit (s)
Dependant variable
Garden still available
1 if household has a garden , 0 otherwise Dummy
Independent variables
Age
Age of a household
Years
Sex
1 for a male household, 0 otherwise
Dummy
Education level
The highest qualification the household
possesses
Number
Household income
Household incomes
Rands
Household members
Household members
Number
Household expenditure
Household expenditure
Rands
Irrigation access; garden tool; homestead
initiative
1 if household has irrigation access,
0 otherwise
Dummy
1 if household has a garden tool,
0 otherwise
Dummy
1 if home garden initiative is working,
0 otherwise
Dummy
14 Mechanism for Improving the Sustainability of Homestead Food Gardens. . .
307
ð14:1Þ
where, Wi is the dependent variable value for person i. Xi is the independent variable
value for person i. _ and _ are parameter values. i is the random error term. The
parameter _ is called the intercept or the value of W when X ¼ 0. The parameter _ is
called the slope or the change in W when X increases by one.
The sample data variables predicted an 87% for Cox and Snell (measure for
binary logistics regression); 91% for McFadden (measure for multinomial and
ordered logit) variation in the dependent variable was explained by the independent
variables. Prediction accuracy was assessed based on the coefficient of determination
(R
2 ). The coefficient of determination R
2 was used to explain the total proportion of
variance in the dependent variable explained by the independent variable. The R
2
removes the influence of the independent variable not accounted for in the
constructs. R
2 is always between 0 and 100%. In general, the higher the R
2 value,
the better the model fits the data, and Table 14.1 indicates the variables used.
The following approach was used to explain the odds ratio (Greenfield et al.
2008):
An odds ratio (OR) is a measure of association between an exposure and an
outcome. The odds ratio can also be used to determine whether a particular exposure
is a risk factor for a particular outcome, and to compare the magnitude of various risk
factors for that outcome (Odds Ratio ¼ 1 if the exposure does not affect the odds of
the outcome; Odds Ratio >1 if the exposure is associated with higher odds of the
outcome; and Odds Ratio <1 if the exposure is associated with lower odds of the
outcome).
When the logistic regression is calculated, the regression coefficient (b1) is the
estimated increase in the log odds of the outcome per unit increase in the value of the
Table 14.1 Description of variables used in the study
Variables
Description of variables
Unit (s)
Dependant variable
Garden still available
1 if household has a garden , 0 otherwise Dummy
Independent variables
Age
Age of a household
Years
Sex
1 for a male household, 0 otherwise
Dummy
Education level
The highest qualification the household
possesses
Number
Household income
Household incomes
Rands
Household members
Household members
Number
Household expenditure
Household expenditure
Rands
Irrigation access; garden tool; homestead
initiative
1 if household has irrigation access,
0 otherwise
Dummy
1 if household has a garden tool,
0 otherwise
Dummy
1 if home garden initiative is working,
0 otherwise
Dummy
14 Mechanism for Improving the Sustainability of Homestead Food Gardens. . .
307