

13.2 Influence of Energy Demand on Climate Change Factors
Among the top ten Global GHG emitters, India now stands fourth, trailing behind
China, the USA and European Union. Among the different economic activities, the
agriculture, forestry and other land use sectors contribute one-fourth of the total
GHG emissions. India’s GHG emissions in 2014 were 2607.48 million metric tons
without land use, land-use change and forestry (LULUCF). The net national GHG
emissions including the LULUCF sector were 2306.29 million metric tons of CO2e,
as the LULUCF sector is a net sink. The LULUCF sectors were able to remove about
12% of India’s GHG emissions. India’s GHG emissions source includes sectors like
energy, “Industrial Processes and Product Use”, agriculture and waste sector. 73% of
the total GHG emissions for the year 2014 were contributed by the energy sector.
While the “Industrial Processes and Product Use” (IPPU) is responsible for 8% of
the total GHG emissions, the agriculture sector accounted for 16% of the GHG
emissions in 2014. It must be noted here that the two important GHGs methane and
nitrous oxide are released mainly from the agriculture activity. The contribution of
the waste sector to the national GHG emissions is to an extent of 3% for the year
2014. Within the waste sector, emissions are mainly from the handling of wastewater
and solid waste disposal. In terms of the gas-wise distribution of India’s GHG
emissions for the year 2014, carbon dioxide accounts for 76.6%, methane for
16.1% and nitrous oxide for 5.7% (MoEFCC 2018).
India is the second largest energy consumer of Asia, since 2008 and 3
rd at the
Global level, trailing the USA and China. India’s energy consumption during
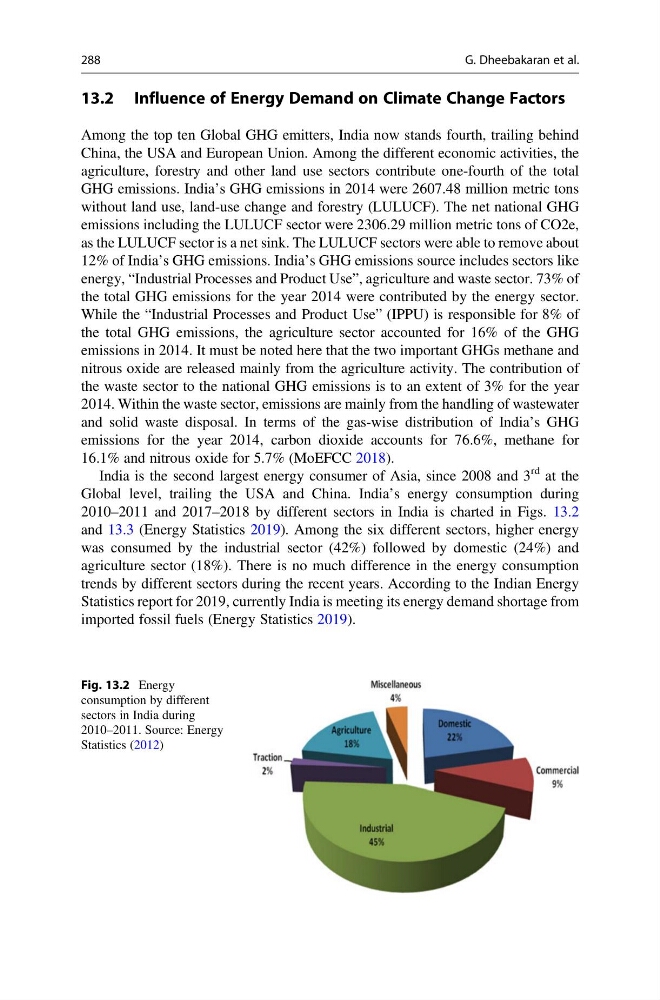
2010–2011 and 2017–2018 by different sectors in India is charted in Figs. 13.2
and 13.3 (Energy Statistics 2019). Among the six different sectors, higher energy
was consumed by the industrial sector (42%) followed by domestic (24%) and
agriculture sector (18%). There is no much difference in the energy consumption
trends by different sectors during the recent years. According to the Indian Energy
Statistics report for 2019, currently India is meeting its energy demand shortage from
imported fossil fuels (Energy Statistics 2019).
Fig. 13.2 Energy
consumption by different
sectors in India during
2010–2011. Source: Energy
Statistics (2012)
288
G. Dheebakaran et al.
Among the top ten Global GHG emitters, India now stands fourth, trailing behind
China, the USA and European Union. Among the different economic activities, the
agriculture, forestry and other land use sectors contribute one-fourth of the total
GHG emissions. India’s GHG emissions in 2014 were 2607.48 million metric tons
without land use, land-use change and forestry (LULUCF). The net national GHG
emissions including the LULUCF sector were 2306.29 million metric tons of CO2e,
as the LULUCF sector is a net sink. The LULUCF sectors were able to remove about
12% of India’s GHG emissions. India’s GHG emissions source includes sectors like
energy, “Industrial Processes and Product Use”, agriculture and waste sector. 73% of
the total GHG emissions for the year 2014 were contributed by the energy sector.
While the “Industrial Processes and Product Use” (IPPU) is responsible for 8% of
the total GHG emissions, the agriculture sector accounted for 16% of the GHG
emissions in 2014. It must be noted here that the two important GHGs methane and
nitrous oxide are released mainly from the agriculture activity. The contribution of
the waste sector to the national GHG emissions is to an extent of 3% for the year
2014. Within the waste sector, emissions are mainly from the handling of wastewater
and solid waste disposal. In terms of the gas-wise distribution of India’s GHG
emissions for the year 2014, carbon dioxide accounts for 76.6%, methane for
16.1% and nitrous oxide for 5.7% (MoEFCC 2018).
India is the second largest energy consumer of Asia, since 2008 and 3
rd at the
Global level, trailing the USA and China. India’s energy consumption during
2010–2011 and 2017–2018 by different sectors in India is charted in Figs. 13.2
and 13.3 (Energy Statistics 2019). Among the six different sectors, higher energy
was consumed by the industrial sector (42%) followed by domestic (24%) and
agriculture sector (18%). There is no much difference in the energy consumption
trends by different sectors during the recent years. According to the Indian Energy
Statistics report for 2019, currently India is meeting its energy demand shortage from
imported fossil fuels (Energy Statistics 2019).
Fig. 13.2 Energy
consumption by different
sectors in India during
2010–2011. Source: Energy
Statistics (2012)
288
G. Dheebakaran et al.