

120
M. D. Petrovi´ c et al.
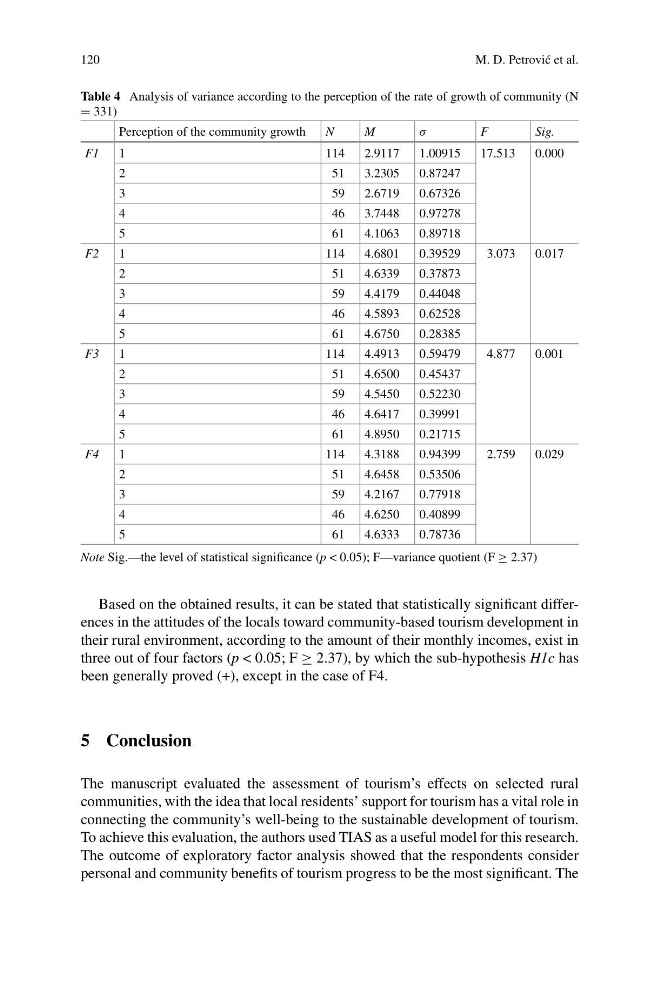
Table 4 Analysis of variance according to the perception of the rate of growth of community (N
= 331)
Perception of the community growth
N
M
σ
F
Sig.
F1
1
114
2.9117
1.00915
17.513
0.000
2
51
3.2305
0.87247
3
59
2.6719
0.67326
4
46
3.7448
0.97278
5
61
4.1063
0.89718
F2
1
114
4.6801
0.39529
3.073
0.017
2
51
4.6339
0.37873
3
59
4.4179
0.44048
4
46
4.5893
0.62528
5
61
4.6750
0.28385
F3
1
114
4.4913
0.59479
4.877
0.001
2
51
4.6500
0.45437
3
59
4.5450
0.52230
4
46
4.6417
0.39991
5
61
4.8950
0.21715
F4
1
114
4.3188
0.94399
2.759
0.029
2
51
4.6458
0.53506
3
59
4.2167
0.77918
4
46
4.6250
0.40899
5
61
4.6333
0.78736
Note Sig.—the level of statistical significance (p < 0.05); F—variance quotient (F ≥ 2.37)
Based on the obtained results, it can be stated that statistically significant differences in the attitudes of the locals toward community-based tourism development in
their rural environment, according to the amount of their monthly incomes, exist in
three out of four factors (p < 0.05; F ≥ 2.37), by which the sub-hypothesis H1c has
been generally proved (+), except in the case of F4.
5 Conclusion
The manuscript evaluated the assessment of tourism’s effects on selected rural
communities, with the idea that local residents’ support for tourism has a vital role in
connecting the community’s well-being to the sustainable development of tourism.
To achieve this evaluation, the authors used TIAS as a useful model for this research.
The outcome of exploratory factor analysis showed that the respondents consider
personal and community benefits of tourism progress to be the most significant. The
M. D. Petrovi´ c et al.
Table 4 Analysis of variance according to the perception of the rate of growth of community (N
= 331)
Perception of the community growth
N
M
σ
F
Sig.
F1
1
114
2.9117
1.00915
17.513
0.000
2
51
3.2305
0.87247
3
59
2.6719
0.67326
4
46
3.7448
0.97278
5
61
4.1063
0.89718
F2
1
114
4.6801
0.39529
3.073
0.017
2
51
4.6339
0.37873
3
59
4.4179
0.44048
4
46
4.5893
0.62528
5
61
4.6750
0.28385
F3
1
114
4.4913
0.59479
4.877
0.001
2
51
4.6500
0.45437
3
59
4.5450
0.52230
4
46
4.6417
0.39991
5
61
4.8950
0.21715
F4
1
114
4.3188
0.94399
2.759
0.029
2
51
4.6458
0.53506
3
59
4.2167
0.77918
4
46
4.6250
0.40899
5
61
4.6333
0.78736
Note Sig.—the level of statistical significance (p < 0.05); F—variance quotient (F ≥ 2.37)
Based on the obtained results, it can be stated that statistically significant differences in the attitudes of the locals toward community-based tourism development in
their rural environment, according to the amount of their monthly incomes, exist in
three out of four factors (p < 0.05; F ≥ 2.37), by which the sub-hypothesis H1c has
been generally proved (+), except in the case of F4.
5 Conclusion
The manuscript evaluated the assessment of tourism’s effects on selected rural
communities, with the idea that local residents’ support for tourism has a vital role in
connecting the community’s well-being to the sustainable development of tourism.
To achieve this evaluation, the authors used TIAS as a useful model for this research.
The outcome of exploratory factor analysis showed that the respondents consider
personal and community benefits of tourism progress to be the most significant. The