

Rural Community Prosperity Versus Tourism Progress …
119
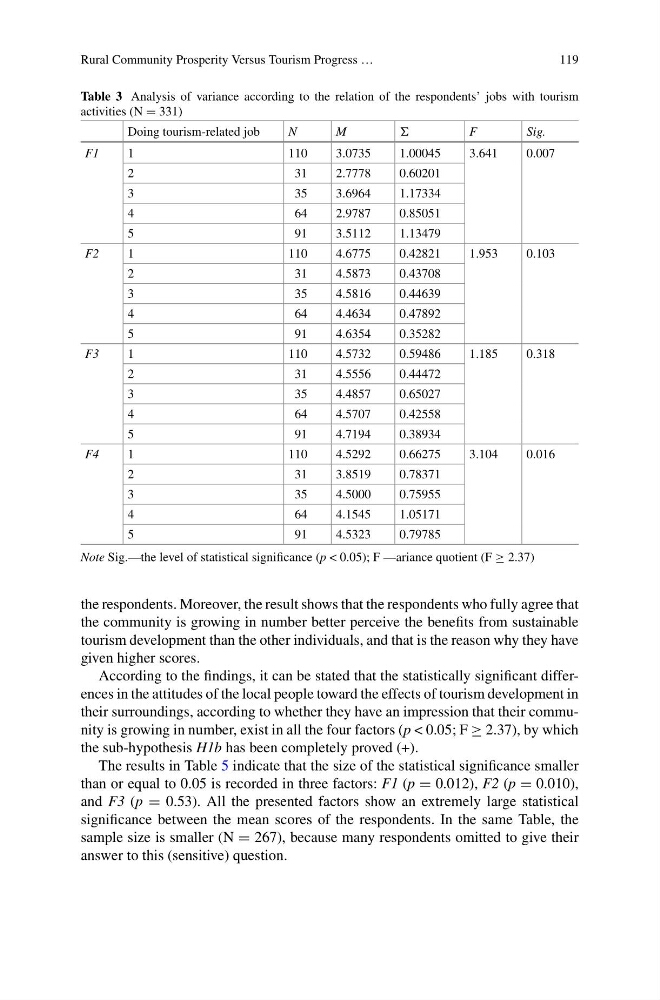
Table 3 Analysis of variance according to the relation of the respondents’ jobs with tourism
activities (N = 331)
Doing tourism-related job
N
M
F
Sig.
F1
1
110
3.0735
1.00045
3.641
0.007
2
31
2.7778
0.60201
3
35
3.6964
1.17334
4
64
2.9787
0.85051
5
91
3.5112
1.13479
F2
1
110
4.6775
0.42821
1.953
0.103
2
31
4.5873
0.43708
3
35
4.5816
0.44639
4
64
4.4634
0.47892
5
91
4.6354
0.35282
F3
1
110
4.5732
0.59486
1.185
0.318
2
31
4.5556
0.44472
3
35
4.4857
0.65027
4
64
4.5707
0.42558
5
91
4.7194
0.38934
F4
1
110
4.5292
0.66275
3.104
0.016
2
31
3.8519
0.78371
3
35
4.5000
0.75955
4
64
4.1545
1.05171
5
91
4.5323
0.79785
Note Sig.—the level of statistical significance (p < 0.05); F —ariance quotient (F ≥ 2.37)
the respondents. Moreover, the result shows that the respondents who fully agree that
the community is growing in number better perceive the benefits from sustainable
tourism development than the other individuals, and that is the reason why they have
given higher scores.
According to the findings, it can be stated that the statistically significant differences in the attitudes of the local people toward the effects of tourism development in
their surroundings, according to whether they have an impression that their community is growing in number, exist in all the four factors (p < 0.05; F ≥ 2.37), by which
the sub-hypothesis H1b has been completely proved (+).
The results in Table 5 indicate that the size of the statistical significance smaller
than or equal to 0.05 is recorded in three factors: F1 (p = 0.012), F2 (p = 0.010),
and F3 (p = 0.53). All the presented factors show an extremely large statistical
significance between the mean scores of the respondents. In the same Table, the
sample size is smaller (N = 267), because many respondents omitted to give their
answer to this (sensitive) question.
119
Table 3 Analysis of variance according to the relation of the respondents’ jobs with tourism
activities (N = 331)
Doing tourism-related job
N
M
F
Sig.
F1
1
110
3.0735
1.00045
3.641
0.007
2
31
2.7778
0.60201
3
35
3.6964
1.17334
4
64
2.9787
0.85051
5
91
3.5112
1.13479
F2
1
110
4.6775
0.42821
1.953
0.103
2
31
4.5873
0.43708
3
35
4.5816
0.44639
4
64
4.4634
0.47892
5
91
4.6354
0.35282
F3
1
110
4.5732
0.59486
1.185
0.318
2
31
4.5556
0.44472
3
35
4.4857
0.65027
4
64
4.5707
0.42558
5
91
4.7194
0.38934
F4
1
110
4.5292
0.66275
3.104
0.016
2
31
3.8519
0.78371
3
35
4.5000
0.75955
4
64
4.1545
1.05171
5
91
4.5323
0.79785
Note Sig.—the level of statistical significance (p < 0.05); F —ariance quotient (F ≥ 2.37)
the respondents. Moreover, the result shows that the respondents who fully agree that
the community is growing in number better perceive the benefits from sustainable
tourism development than the other individuals, and that is the reason why they have
given higher scores.
According to the findings, it can be stated that the statistically significant differences in the attitudes of the local people toward the effects of tourism development in
their surroundings, according to whether they have an impression that their community is growing in number, exist in all the four factors (p < 0.05; F ≥ 2.37), by which
the sub-hypothesis H1b has been completely proved (+).
The results in Table 5 indicate that the size of the statistical significance smaller
than or equal to 0.05 is recorded in three factors: F1 (p = 0.012), F2 (p = 0.010),
and F3 (p = 0.53). All the presented factors show an extremely large statistical
significance between the mean scores of the respondents. In the same Table, the
sample size is smaller (N = 267), because many respondents omitted to give their
answer to this (sensitive) question.