

Rural Community Prosperity Versus Tourism Progress …
121
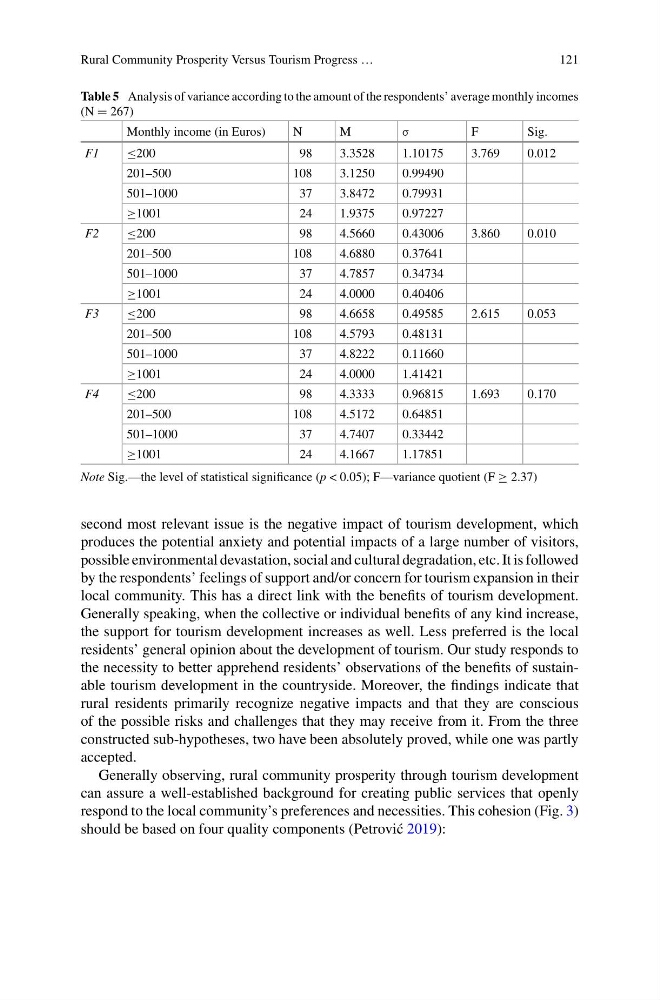
Table 5 Analysis of variance according to the amount of the respondents’ average monthly incomes
(N = 267)
Monthly income (in Euros)
N
M
σ
F
Sig.
F1
≤200
98
3.3528
1.10175
3.769
0.012
201–500
108
3.1250
0.99490
501–1000
37
3.8472
0.79931
≥1001
24
1.9375
0.97227
F2
≤200
98
4.5660
0.43006
3.860
0.010
201–500
108
4.6880
0.37641
501–1000
37
4.7857
0.34734
≥1001
24
4.0000
0.40406
F3
≤200
98
4.6658
0.49585
2.615
0.053
201–500
108
4.5793
0.48131
501–1000
37
4.8222
0.11660
≥1001
24
4.0000
1.41421
F4
≤200
98
4.3333
0.96815
1.693
0.170
201–500
108
4.5172
0.64851
501–1000
37
4.7407
0.33442
≥1001
24
4.1667
1.17851
Note Sig.—the level of statistical significance (p < 0.05); F—variance quotient (F ≥ 2.37)
second most relevant issue is the negative impact of tourism development, which
produces the potential anxiety and potential impacts of a large number of visitors,
possible environmental devastation, social and cultural degradation, etc. It is followed
by the respondents’ feelings of support and/or concern for tourism expansion in their
local community. This has a direct link with the benefits of tourism development.
Generally speaking, when the collective or individual benefits of any kind increase,
the support for tourism development increases as well. Less preferred is the local
residents’ general opinion about the development of tourism. Our study responds to
the necessity to better apprehend residents’ observations of the benefits of sustainable tourism development in the countryside. Moreover, the findings indicate that
rural residents primarily recognize negative impacts and that they are conscious
of the possible risks and challenges that they may receive from it. From the three
constructed sub-hypotheses, two have been absolutely proved, while one was partly
accepted.
Generally observing, rural community prosperity through tourism development
can assure a well-established background for creating public services that openly
respond to the local community’s preferences and necessities. This cohesion (Fig. 3)
should be based on four quality components (Petrovi´ c 2019):
121
Table 5 Analysis of variance according to the amount of the respondents’ average monthly incomes
(N = 267)
Monthly income (in Euros)
N
M
σ
F
Sig.
F1
≤200
98
3.3528
1.10175
3.769
0.012
201–500
108
3.1250
0.99490
501–1000
37
3.8472
0.79931
≥1001
24
1.9375
0.97227
F2
≤200
98
4.5660
0.43006
3.860
0.010
201–500
108
4.6880
0.37641
501–1000
37
4.7857
0.34734
≥1001
24
4.0000
0.40406
F3
≤200
98
4.6658
0.49585
2.615
0.053
201–500
108
4.5793
0.48131
501–1000
37
4.8222
0.11660
≥1001
24
4.0000
1.41421
F4
≤200
98
4.3333
0.96815
1.693
0.170
201–500
108
4.5172
0.64851
501–1000
37
4.7407
0.33442
≥1001
24
4.1667
1.17851
Note Sig.—the level of statistical significance (p < 0.05); F—variance quotient (F ≥ 2.37)
second most relevant issue is the negative impact of tourism development, which
produces the potential anxiety and potential impacts of a large number of visitors,
possible environmental devastation, social and cultural degradation, etc. It is followed
by the respondents’ feelings of support and/or concern for tourism expansion in their
local community. This has a direct link with the benefits of tourism development.
Generally speaking, when the collective or individual benefits of any kind increase,
the support for tourism development increases as well. Less preferred is the local
residents’ general opinion about the development of tourism. Our study responds to
the necessity to better apprehend residents’ observations of the benefits of sustainable tourism development in the countryside. Moreover, the findings indicate that
rural residents primarily recognize negative impacts and that they are conscious
of the possible risks and challenges that they may receive from it. From the three
constructed sub-hypotheses, two have been absolutely proved, while one was partly
accepted.
Generally observing, rural community prosperity through tourism development
can assure a well-established background for creating public services that openly
respond to the local community’s preferences and necessities. This cohesion (Fig. 3)
should be based on four quality components (Petrovi´ c 2019):