

Development of Hydrologic Modeling for Koraiyar Basin
The hydrologic model developed by integrating with GIS, known as HEC-Geo
HMS, is used to develop the model for the basin. The runoff from the rainfall is
generated through HEC-HMS.
Digital Elevation Model of Study Area
The toposheet does not contain the elevation contours of the basin, so the elevation
of the study area could not be done by using the topo sheet alone. Therefore, the
Advanced Land Observing Satellite (ALOS) from Japan Aerospace Exploration
Agency (JAXA) of 30 m resolution is adopted. The basin is delineated into subbasins, and a total of 27 subbasins are delineated in the Koraiyar basin (Fig. 3.7). The
total area of the basin is 1498 km
2 .
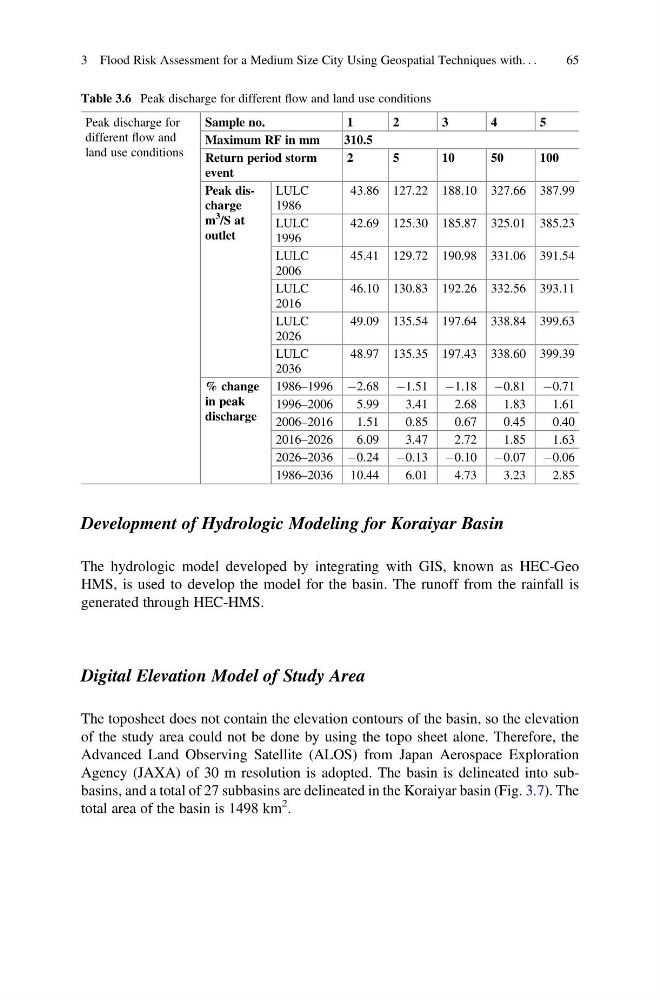
Table 3.6 Peak discharge for different flow and land use conditions
Peak discharge for
different flow and
land use conditions
Sample no.
1
2
3
4
5
Maximum RF in mm
310.5
Return period storm
event
2
5
10
50
100
Peak discharge
m
3
/S at
outlet
LULC
1986
43.86 127.22 188.10 327.66 387.99
LULC
1996
42.69 125.30 185.87 325.01 385.23
LULC
2006
45.41 129.72 190.98 331.06 391.54
LULC
2016
46.10 130.83 192.26 332.56 393.11
LULC
2026
49.09 135.54 197.64 338.84 399.63
LULC
2036
48.97 135.35 197.43 338.60 399.39
% change
in peak
discharge
1986–1996 À2.68 À1.51 À1.18 À0.81 À0.71
1996–2006
5.99
3.41
2.68
1.83
1.61
2006–2016
1.51
0.85
0.67
0.45
0.40
2016–2026
6.09
3.47
2.72
1.85
1.63
2026–2036 À0.24 À0.13 À0.10 À0.07 À0.06
1986–2036 10.44
6.01
4.73
3.23
2.85
3 Flood Risk Assessment for a Medium Size City Using Geospatial Techniques with. . .
65
The hydrologic model developed by integrating with GIS, known as HEC-Geo
HMS, is used to develop the model for the basin. The runoff from the rainfall is
generated through HEC-HMS.
Digital Elevation Model of Study Area
The toposheet does not contain the elevation contours of the basin, so the elevation
of the study area could not be done by using the topo sheet alone. Therefore, the
Advanced Land Observing Satellite (ALOS) from Japan Aerospace Exploration
Agency (JAXA) of 30 m resolution is adopted. The basin is delineated into subbasins, and a total of 27 subbasins are delineated in the Koraiyar basin (Fig. 3.7). The
total area of the basin is 1498 km
2 .
Table 3.6 Peak discharge for different flow and land use conditions
Peak discharge for
different flow and
land use conditions
Sample no.
1
2
3
4
5
Maximum RF in mm
310.5
Return period storm
event
2
5
10
50
100
Peak discharge
m
3
/S at
outlet
LULC
1986
43.86 127.22 188.10 327.66 387.99
LULC
1996
42.69 125.30 185.87 325.01 385.23
LULC
2006
45.41 129.72 190.98 331.06 391.54
LULC
2016
46.10 130.83 192.26 332.56 393.11
LULC
2026
49.09 135.54 197.64 338.84 399.63
LULC
2036
48.97 135.35 197.43 338.60 399.39
% change
in peak
discharge
1986–1996 À2.68 À1.51 À1.18 À0.81 À0.71
1996–2006
5.99
3.41
2.68
1.83
1.61
2006–2016
1.51
0.85
0.67
0.45
0.40
2016–2026
6.09
3.47
2.72
1.85
1.63
2026–2036 À0.24 À0.13 À0.10 À0.07 À0.06
1986–2036 10.44
6.01
4.73
3.23
2.85
3 Flood Risk Assessment for a Medium Size City Using Geospatial Techniques with. . .
65