

Analysis of Runoff for Change in Different Years of Land Use
Conditions
The extreme rainfall event that occurred on 22 November 1999 is used for generating
peak discharge through the SCS method. The generated peak discharges for different
return periods are shown in Table 3.6. From the analysis, the 2 years return period
has less runoff compared to the 100 years return period. The peak discharge
increases because of an increase in CN from 1986 to 2016. In the future simulation
for the years 2026 and 2036, the runoff increases because of an increase in CN. The
LULC change and its influence on surface runoff are analyzed from Eq. (3.8).
F ¼
P
R 2
P
R 1
ð3:8Þ
The calculated rainfall and the LULC data of 1986 runoff of the year are
estimated for the Koraiyar basin. The runoff constitutes the function of rainfall of
the year 1999 and the land use data of 1986–2016. From the analysis, it is noted that
the total runoff of the year 1986 is ∑R 1 , 43.86 m
3 /s for the 2 years return period, and
the total runoff of the year 1996 is ∑R 2 , is 42.69 m
3
/s. The impact factor for land use
and land cover and its effects on the surface runoff on the Koraiyar basin for the
2 years return period is 0.973. It is a deciding factor for measuring the effects of
LULC in the surface runoff in the basin.
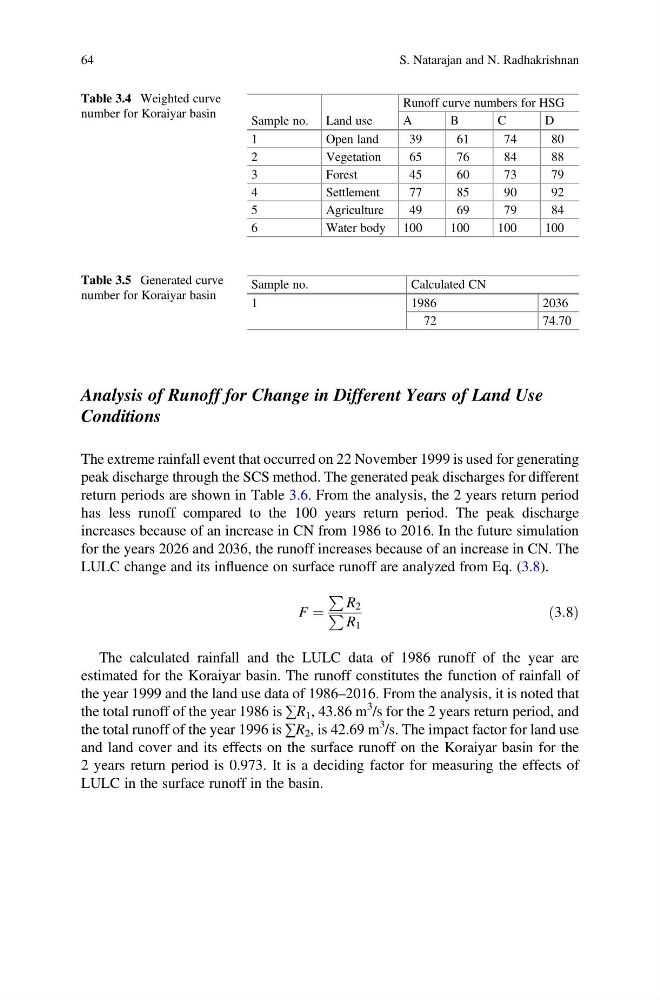
Table 3.5 Generated curve
number for Koraiyar basin
Sample no.
Calculated CN
1
1986
2036
72
74.70
Table 3.4 Weighted curve
number for Koraiyar basin
Sample no. Land use
Runoff curve numbers for HSG
A
B
C
D
1
Open land
39
61
74
80
2
Vegetation
65
76
84
88
3
Forest
45
60
73
79
4
Settlement
77
85
90
92
5
Agriculture
49
69
79
84
6
Water body 100
100
100
100
64
S. Natarajan and N. Radhakrishnan
Conditions
The extreme rainfall event that occurred on 22 November 1999 is used for generating
peak discharge through the SCS method. The generated peak discharges for different
return periods are shown in Table 3.6. From the analysis, the 2 years return period
has less runoff compared to the 100 years return period. The peak discharge
increases because of an increase in CN from 1986 to 2016. In the future simulation
for the years 2026 and 2036, the runoff increases because of an increase in CN. The
LULC change and its influence on surface runoff are analyzed from Eq. (3.8).
F ¼
P
R 2
P
R 1
ð3:8Þ
The calculated rainfall and the LULC data of 1986 runoff of the year are
estimated for the Koraiyar basin. The runoff constitutes the function of rainfall of
the year 1999 and the land use data of 1986–2016. From the analysis, it is noted that
the total runoff of the year 1986 is ∑R 1 , 43.86 m
3 /s for the 2 years return period, and
the total runoff of the year 1996 is ∑R 2 , is 42.69 m
3
/s. The impact factor for land use
and land cover and its effects on the surface runoff on the Koraiyar basin for the
2 years return period is 0.973. It is a deciding factor for measuring the effects of
LULC in the surface runoff in the basin.
Table 3.5 Generated curve
number for Koraiyar basin
Sample no.
Calculated CN
1
1986
2036
72
74.70
Table 3.4 Weighted curve
number for Koraiyar basin
Sample no. Land use
Runoff curve numbers for HSG
A
B
C
D
1
Open land
39
61
74
80
2
Vegetation
65
76
84
88
3
Forest
45
60
73
79
4
Settlement
77
85
90
92
5
Agriculture
49
69
79
84
6
Water body 100
100
100
100
64
S. Natarajan and N. Radhakrishnan