

Results and Discussion
Estimation of Runoff Curve Numbers from Indian Conditions
The Hydrologic Soil Group (HSG) divides the soil into types A, B, C, and D. The
weighted existing and predicted curve numbers for the Koraiyar basin are shown in
Table 3.4.
The CN model developed by the SCS CN approach shows that the overall
generated curve number increases or decreases for the various land cover classes
in the basin from 1986 to 2016, and the predicted CN is also shown in Table 3.5. In
the year 1986, the curve number generated is 72, but a decrease in CN is noted in the
year 1996, a decrease of 0.01% of the total number produced. The CN for the years
2006 and 2016 shows an increase from 72.83 to 73.20, with an increase of 0.005%.
In the past 30 years, the increase in CN is 0.001% in the whole basin. The reason for
the increasing and decreasing CN in the basin is the LULC transition process. It
occurs in the form of an increase or decrease of open land and conversion of
agriculture land into open land or change of vegetation into open land. The increase
in CN is the result of reduction in agricultural land. The future simulation of curve
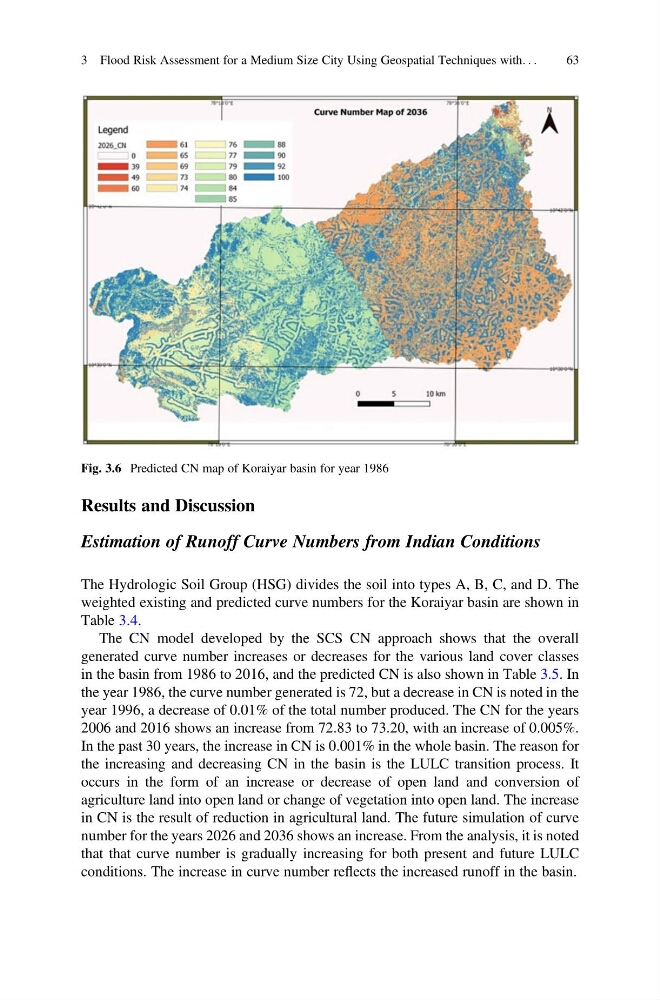
number for the years 2026 and 2036 shows an increase. From the analysis, it is noted
that that curve number is gradually increasing for both present and future LULC
conditions. The increase in curve number reflects the increased runoff in the basin.
Fig. 3.6 Predicted CN map of Koraiyar basin for year 1986
3 Flood Risk Assessment for a Medium Size City Using Geospatial Techniques with. . .
63
Estimation of Runoff Curve Numbers from Indian Conditions
The Hydrologic Soil Group (HSG) divides the soil into types A, B, C, and D. The
weighted existing and predicted curve numbers for the Koraiyar basin are shown in
Table 3.4.
The CN model developed by the SCS CN approach shows that the overall
generated curve number increases or decreases for the various land cover classes
in the basin from 1986 to 2016, and the predicted CN is also shown in Table 3.5. In
the year 1986, the curve number generated is 72, but a decrease in CN is noted in the
year 1996, a decrease of 0.01% of the total number produced. The CN for the years
2006 and 2016 shows an increase from 72.83 to 73.20, with an increase of 0.005%.
In the past 30 years, the increase in CN is 0.001% in the whole basin. The reason for
the increasing and decreasing CN in the basin is the LULC transition process. It
occurs in the form of an increase or decrease of open land and conversion of
agriculture land into open land or change of vegetation into open land. The increase
in CN is the result of reduction in agricultural land. The future simulation of curve
number for the years 2026 and 2036 shows an increase. From the analysis, it is noted
that that curve number is gradually increasing for both present and future LULC
conditions. The increase in curve number reflects the increased runoff in the basin.
Fig. 3.6 Predicted CN map of Koraiyar basin for year 1986
3 Flood Risk Assessment for a Medium Size City Using Geospatial Techniques with. . .
63