

Rainfall Analysis
The daily rainfall data are collected and converted into hourly rainfall data by the
IMD method. In this study an extreme rainfall event that occurred in one day
between 1976 and 2016 was selected for the study. In these 40 years, the highest
extreme event, which occurred on 22 November 1999, was selected for the study.
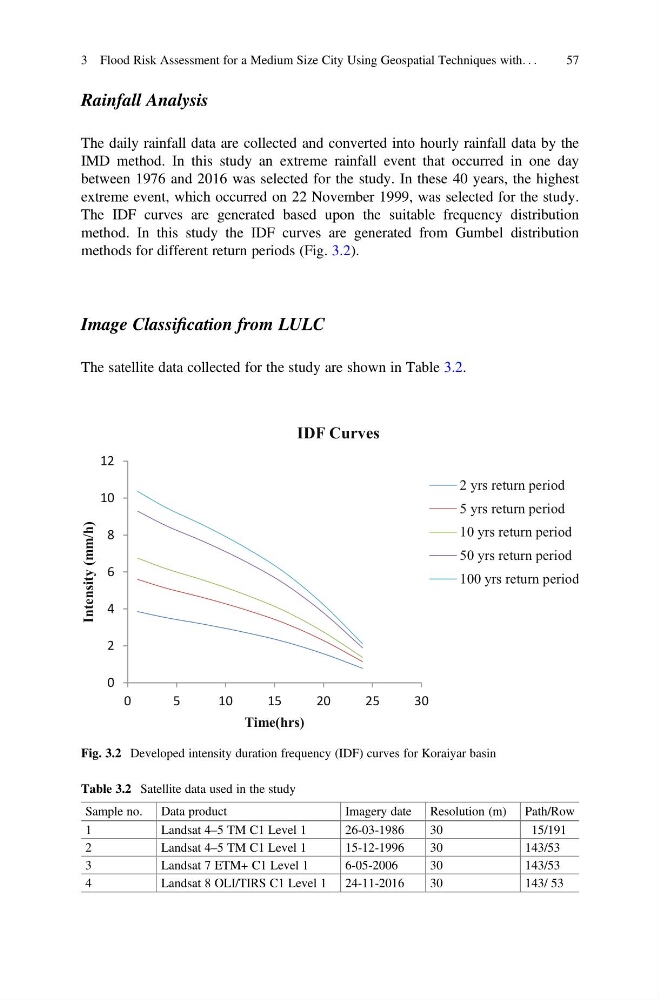
The IDF curves are generated based upon the suitable frequency distribution
method. In this study the IDF curves are generated from Gumbel distribution
methods for different return periods (Fig. 3.2).
Image Classification from LULC
The satellite data collected for the study are shown in Table 3.2.
0
2
4
6
8
10
12
0
5
10
15
20
25
30
Intensity (mm/h)
Time(hrs)
IDF Curves
2 yrs return period
5 yrs return period
10 yrs return period
50 yrs return period
100 yrs return period
Fig. 3.2 Developed intensity duration frequency (IDF) curves for Koraiyar basin
Table 3.2 Satellite data used in the study
Sample no. Data product
Imagery date Resolution (m) Path/Row
1
Landsat 4–5 TM C1 Level 1
26-03-1986
30
15/191
2
Landsat 4–5 TM C1 Level 1
15-12-1996
30
143/53
3
Landsat 7 ETM+ C1 Level 1
6-05-2006
30
143/53
4
Landsat 8 OLI/TIRS C1 Level 1 24-11-2016
30
143/ 53
3 Flood Risk Assessment for a Medium Size City Using Geospatial Techniques with. . .
57
The daily rainfall data are collected and converted into hourly rainfall data by the
IMD method. In this study an extreme rainfall event that occurred in one day
between 1976 and 2016 was selected for the study. In these 40 years, the highest
extreme event, which occurred on 22 November 1999, was selected for the study.
The IDF curves are generated based upon the suitable frequency distribution
method. In this study the IDF curves are generated from Gumbel distribution
methods for different return periods (Fig. 3.2).
Image Classification from LULC
The satellite data collected for the study are shown in Table 3.2.
0
2
4
6
8
10
12
0
5
10
15
20
25
30
Intensity (mm/h)
Time(hrs)
IDF Curves
2 yrs return period
5 yrs return period
10 yrs return period
50 yrs return period
100 yrs return period
Fig. 3.2 Developed intensity duration frequency (IDF) curves for Koraiyar basin
Table 3.2 Satellite data used in the study
Sample no. Data product
Imagery date Resolution (m) Path/Row
1
Landsat 4–5 TM C1 Level 1
26-03-1986
30
15/191
2
Landsat 4–5 TM C1 Level 1
15-12-1996
30
143/53
3
Landsat 7 ETM+ C1 Level 1
6-05-2006
30
143/53
4
Landsat 8 OLI/TIRS C1 Level 1 24-11-2016
30
143/ 53
3 Flood Risk Assessment for a Medium Size City Using Geospatial Techniques with. . .
57