

establishment of forest reserves and for development of forest management practices
designed to protect this high quality. Some forest management activities such as road
construction, harvesting, site preparation for regeneration of forest tree species, and
fertilization of existing forest have been shown to alter water quality, primarily by
causing changes in sediment loads, stream temperature, dissolved oxygen, and
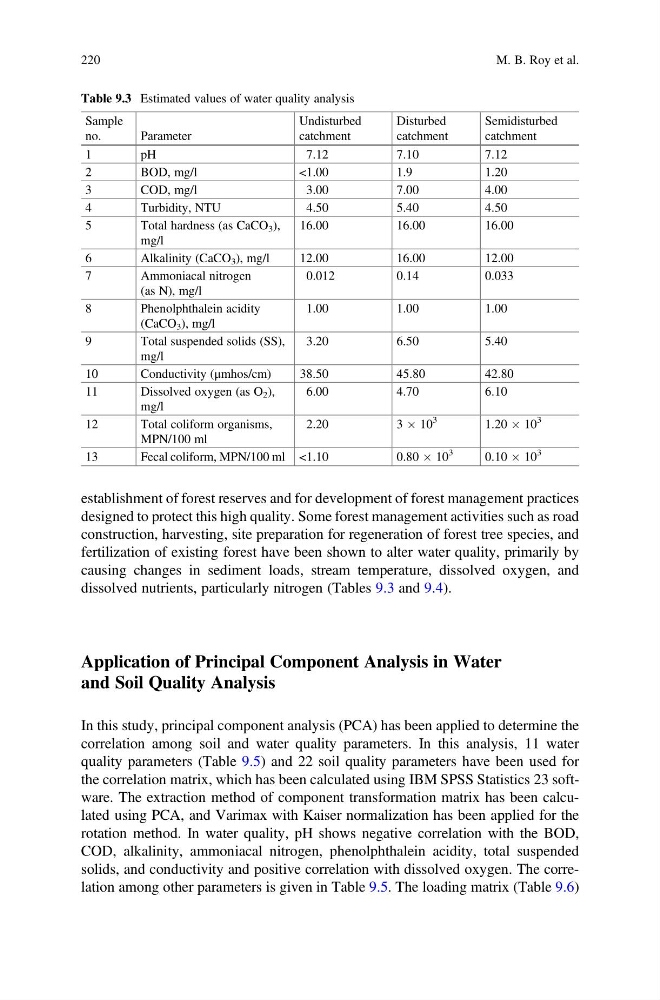
dissolved nutrients, particularly nitrogen (Tables 9.3 and 9.4).
Application of Principal Component Analysis in Water
and Soil Quality Analysis
In this study, principal component analysis (PCA) has been applied to determine the
correlation among soil and water quality parameters. In this analysis, 11 water
quality parameters (Table 9.5) and 22 soil quality parameters have been used for
the correlation matrix, which has been calculated using IBM SPSS Statistics 23 software. The extraction method of component transformation matrix has been calculated using PCA, and Varimax with Kaiser normalization has been applied for the
rotation method. In water quality, pH shows negative correlation with the BOD,
COD, alkalinity, ammoniacal nitrogen, phenolphthalein acidity, total suspended
solids, and conductivity and positive correlation with dissolved oxygen. The correlation among other parameters is given in Table 9.5. The loading matrix (Table 9.6)
Table 9.3 Estimated values of water quality analysis
Sample
no.
Parameter
Undisturbed
catchment
Disturbed
catchment
Semidisturbed
catchment
1
pH
7.12
7.10
7.12
2
BOD, mg/l
<1.00
1.9
1.20
3
COD, mg/l
3.00
7.00
4.00
4
Turbidity, NTU
4.50
5.40
4.50
5
Total hardness (as CaCO 3 ),
mg/l
16.00
16.00
16.00
6
Alkalinity (CaCO 3 ), mg/l
12.00
16.00
12.00
7
Ammoniacal nitrogen
(as N), mg/l
0.012
0.14
0.033
8
Phenolphthalein acidity
(CaCO 3 ), mg/l
1.00
1.00
1.00
9
Total suspended solids (SS),
mg/l
3.20
6.50
5.40
10
Conductivity (μmhos/cm)
38.50
45.80
42.80
11
Dissolved oxygen (as O 2 ),
mg/l
6.00
4.70
6.10
12
Total coliform organisms,
MPN/100 ml
2.20
3 Â 10
3
1.20 Â 10
3
13
Fecal coliform, MPN/100 ml <1.10
0.80 Â 10
3
0.10 Â 10
3
220
M. B. Roy et al.
designed to protect this high quality. Some forest management activities such as road
construction, harvesting, site preparation for regeneration of forest tree species, and
fertilization of existing forest have been shown to alter water quality, primarily by
causing changes in sediment loads, stream temperature, dissolved oxygen, and
dissolved nutrients, particularly nitrogen (Tables 9.3 and 9.4).
Application of Principal Component Analysis in Water
and Soil Quality Analysis
In this study, principal component analysis (PCA) has been applied to determine the
correlation among soil and water quality parameters. In this analysis, 11 water
quality parameters (Table 9.5) and 22 soil quality parameters have been used for
the correlation matrix, which has been calculated using IBM SPSS Statistics 23 software. The extraction method of component transformation matrix has been calculated using PCA, and Varimax with Kaiser normalization has been applied for the
rotation method. In water quality, pH shows negative correlation with the BOD,
COD, alkalinity, ammoniacal nitrogen, phenolphthalein acidity, total suspended
solids, and conductivity and positive correlation with dissolved oxygen. The correlation among other parameters is given in Table 9.5. The loading matrix (Table 9.6)
Table 9.3 Estimated values of water quality analysis
Sample
no.
Parameter
Undisturbed
catchment
Disturbed
catchment
Semidisturbed
catchment
1
pH
7.12
7.10
7.12
2
BOD, mg/l
<1.00
1.9
1.20
3
COD, mg/l
3.00
7.00
4.00
4
Turbidity, NTU
4.50
5.40
4.50
5
Total hardness (as CaCO 3 ),
mg/l
16.00
16.00
16.00
6
Alkalinity (CaCO 3 ), mg/l
12.00
16.00
12.00
7
Ammoniacal nitrogen
(as N), mg/l
0.012
0.14
0.033
8
Phenolphthalein acidity
(CaCO 3 ), mg/l
1.00
1.00
1.00
9
Total suspended solids (SS),
mg/l
3.20
6.50
5.40
10
Conductivity (μmhos/cm)
38.50
45.80
42.80
11
Dissolved oxygen (as O 2 ),
mg/l
6.00
4.70
6.10
12
Total coliform organisms,
MPN/100 ml
2.20
3 Â 10
3
1.20 Â 10
3
13
Fecal coliform, MPN/100 ml <1.10
0.80 Â 10
3
0.10 Â 10
3
220
M. B. Roy et al.