

Z ¼
S À 1
ffiffiffiffiffiffiffiffiffiffiffiffiffiffiffiffi ffi
VAR S
ð Þ
p
, if S > 0
0
, i fS ¼ 0
S þ 1
ffiffiffiffiffiffiffiffiffiffiffiffiffiffiffiffi ffi
VAR S
ð Þ
p
, if S < 0
8
> > > > > > <
> > > > > > :
ð7:5Þ
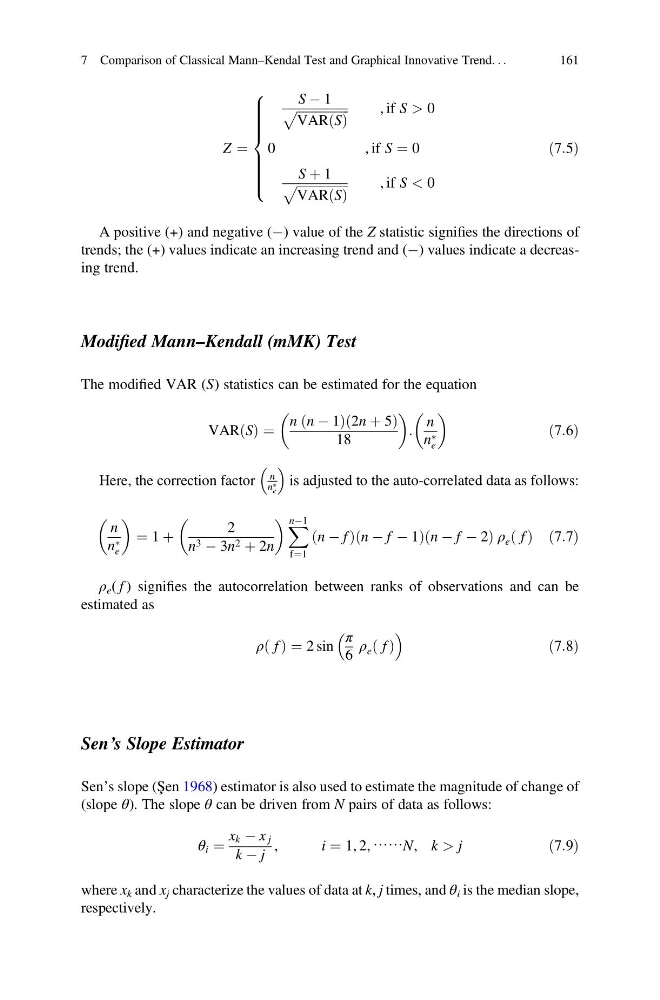
A positive (+) and negative (À) value of the Z statistic signifies the directions of
trends; the (+) values indicate an increasing trend and (À) values indicate a decreasing trend.
Modified Mann–Kendall (mMK) Test
The modified VAR (S) statistics can be estimated for the equation
VAR S
ð Þ ¼
n n À 1
ð
Þ 2n þ 5
ð
Þ
18
:
n
n Ã
e
ð7:6Þ
Here, the correction factor
n
n Ã
e
is adjusted to the auto-correlated data as follows:
n
n Ã
e
¼ 1 þ
2
n 3 À 3n 2 þ 2n
X nÀ1
f¼1
n À f
ð
Þ n À f À 1
ð
Þn À f À 2
ð
Þρ e f
ð Þ ð7:7Þ
ρ e ( f ) signifies the autocorrelation between ranks of observations and can be
estimated as
ρ f
ð Þ ¼ 2 sin
π
6
ρ e f
ð Þ
ð7:8Þ
Sen’s Slope Estimator
Sen’s slope (Şen 1968) estimator is also used to estimate the magnitude of change of
(slope θ). The slope θ can be driven from N pairs of data as follows:
θ i ¼
x k À x j
k À j
,
i ¼ 1, 2, ⋯⋯N, k > j
ð7:9Þ
where x k and x j characterize the values of data at k, j times, and θ i is the median slope,
respectively.
7 Comparison of Classical Mann–Kendal Test and Graphical Innovative Trend. . .
161
S À 1
ffiffiffiffiffiffiffiffiffiffiffiffiffiffiffiffi ffi
VAR S
ð Þ
p
, if S > 0
0
, i fS ¼ 0
S þ 1
ffiffiffiffiffiffiffiffiffiffiffiffiffiffiffiffi ffi
VAR S
ð Þ
p
, if S < 0
8
> > > > > > <
> > > > > > :
ð7:5Þ
A positive (+) and negative (À) value of the Z statistic signifies the directions of
trends; the (+) values indicate an increasing trend and (À) values indicate a decreasing trend.
Modified Mann–Kendall (mMK) Test
The modified VAR (S) statistics can be estimated for the equation
VAR S
ð Þ ¼
n n À 1
ð
Þ 2n þ 5
ð
Þ
18
:
n
n Ã
e
ð7:6Þ
Here, the correction factor
n
n Ã
e
is adjusted to the auto-correlated data as follows:
n
n Ã
e
¼ 1 þ
2
n 3 À 3n 2 þ 2n
X nÀ1
f¼1
n À f
ð
Þ n À f À 1
ð
Þn À f À 2
ð
Þρ e f
ð Þ ð7:7Þ
ρ e ( f ) signifies the autocorrelation between ranks of observations and can be
estimated as
ρ f
ð Þ ¼ 2 sin
π
6
ρ e f
ð Þ
ð7:8Þ
Sen’s Slope Estimator
Sen’s slope (Şen 1968) estimator is also used to estimate the magnitude of change of
(slope θ). The slope θ can be driven from N pairs of data as follows:
θ i ¼
x k À x j
k À j
,
i ¼ 1, 2, ⋯⋯N, k > j
ð7:9Þ
where x k and x j characterize the values of data at k, j times, and θ i is the median slope,
respectively.
7 Comparison of Classical Mann–Kendal Test and Graphical Innovative Trend. . .
161