

points are concentrated along the trend line, this indicates there is no trend in the data
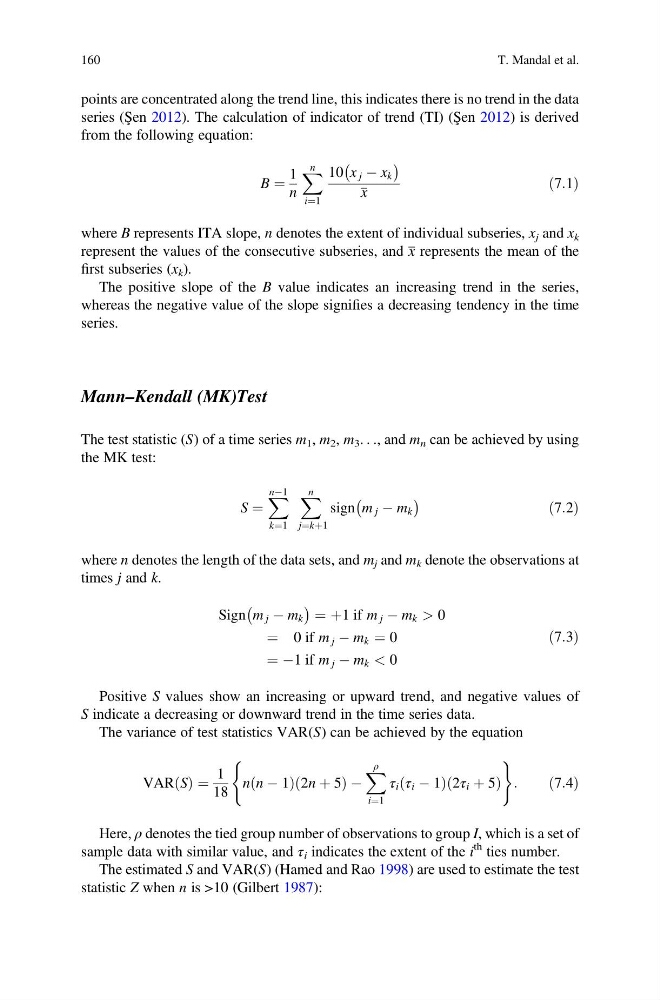
series (Şen 2012). The calculation of indicator of trend (TI) (Şen 2012) is derived
from the following equation:
B ¼
1
n
X n
i¼1
10 x j À x k
À
Á
x
ð7:1Þ
where B represents ITA slope, n denotes the extent of individual subseries, x j and x k
represent the values of the consecutive subseries, and x represents the mean of the
first subseries (x k ).
The positive slope of the B value indicates an increasing trend in the series,
whereas the negative value of the slope signifies a decreasing tendency in the time
series.
Mann–Kendall (MK)Test
The test statistic (S) of a time series m 1 , m 2 , m 3 . . ., and m n can be achieved by using
the MK test:
S ¼
X nÀ1
k¼1
X n
j¼kþ1
sign m j À m k
À
Á
ð7:2Þ
where n denotes the length of the data sets, and m j and m k denote the observations at
times j and k.
Sign m j À m k
À
Á ¼ þ1 if m j À m k > 0
¼ 0 if m j À m k ¼ 0
¼ À1 if m j À m k < 0
ð7:3Þ
Positive S values show an increasing or upward trend, and negative values of
S indicate a decreasing or downward trend in the time series data.
The variance of test statistics VAR(S) can be achieved by the equation
VAR S
ð Þ ¼
1
18
n n À 1
ð
Þ 2n þ 5
ð
ÞÀ
X ρ
i¼1
τ i τ i À 1
ð
Þ 2τ i þ 5
ð
Þ
(
)
:
ð7:4Þ
Here, ρ denotes the tied group number of observations to group I, which is a set of
sample data with similar value, and τ i indicates the extent of the i
th ties number.
The estimated S and VAR(S) (Hamed and Rao 1998) are used to estimate the test
statistic Z when n is >10 (Gilbert 1987):
160
T. Mandal et al.
series (Şen 2012). The calculation of indicator of trend (TI) (Şen 2012) is derived
from the following equation:
B ¼
1
n
X n
i¼1
10 x j À x k
À
Á
x
ð7:1Þ
where B represents ITA slope, n denotes the extent of individual subseries, x j and x k
represent the values of the consecutive subseries, and x represents the mean of the
first subseries (x k ).
The positive slope of the B value indicates an increasing trend in the series,
whereas the negative value of the slope signifies a decreasing tendency in the time
series.
Mann–Kendall (MK)Test
The test statistic (S) of a time series m 1 , m 2 , m 3 . . ., and m n can be achieved by using
the MK test:
S ¼
X nÀ1
k¼1
X n
j¼kþ1
sign m j À m k
À
Á
ð7:2Þ
where n denotes the length of the data sets, and m j and m k denote the observations at
times j and k.
Sign m j À m k
À
Á ¼ þ1 if m j À m k > 0
¼ 0 if m j À m k ¼ 0
¼ À1 if m j À m k < 0
ð7:3Þ
Positive S values show an increasing or upward trend, and negative values of
S indicate a decreasing or downward trend in the time series data.
The variance of test statistics VAR(S) can be achieved by the equation
VAR S
ð Þ ¼
1
18
n n À 1
ð
Þ 2n þ 5
ð
ÞÀ
X ρ
i¼1
τ i τ i À 1
ð
Þ 2τ i þ 5
ð
Þ
(
)
:
ð7:4Þ
Here, ρ denotes the tied group number of observations to group I, which is a set of
sample data with similar value, and τ i indicates the extent of the i
th ties number.
The estimated S and VAR(S) (Hamed and Rao 1998) are used to estimate the test
statistic Z when n is >10 (Gilbert 1987):
160
T. Mandal et al.