

Percent Bias
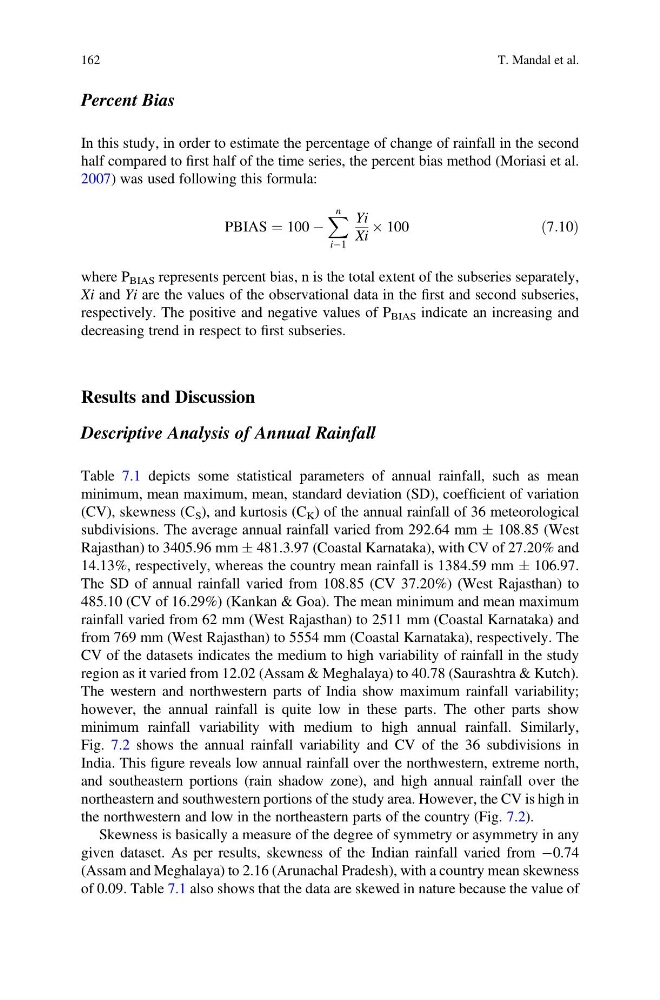
In this study, in order to estimate the percentage of change of rainfall in the second
half compared to first half of the time series, the percent bias method (Moriasi et al.
2007) was used following this formula:
PBIAS ¼ 100 À
X n
iÀ1
Yi
Xi
 100
ð7:10Þ
where P BIAS represents percent bias, n is the total extent of the subseries separately,
Xi and Yi are the values of the observational data in the first and second subseries,
respectively. The positive and negative values of P BIAS indicate an increasing and
decreasing trend in respect to first subseries.
Results and Discussion
Descriptive Analysis of Annual Rainfall
Table 7.1 depicts some statistical parameters of annual rainfall, such as mean
minimum, mean maximum, mean, standard deviation (SD), coefficient of variation
(CV), skewness (C S ), and kurtosis (C K ) of the annual rainfall of 36 meteorological
subdivisions. The average annual rainfall varied from 292.64 mm Æ 108.85 (West
Rajasthan) to 3405.96 mm Æ 481.3.97 (Coastal Karnataka), with CV of 27.20% and
14.13%, respectively, whereas the country mean rainfall is 1384.59 mm Æ 106.97.
The SD of annual rainfall varied from 108.85 (CV 37.20%) (West Rajasthan) to
485.10 (CV of 16.29%) (Kankan & Goa). The mean minimum and mean maximum
rainfall varied from 62 mm (West Rajasthan) to 2511 mm (Coastal Karnataka) and
from 769 mm (West Rajasthan) to 5554 mm (Coastal Karnataka), respectively. The
CV of the datasets indicates the medium to high variability of rainfall in the study
region as it varied from 12.02 (Assam & Meghalaya) to 40.78 (Saurashtra & Kutch).
The western and northwestern parts of India show maximum rainfall variability;
however, the annual rainfall is quite low in these parts. The other parts show
minimum rainfall variability with medium to high annual rainfall. Similarly,
Fig. 7.2 shows the annual rainfall variability and CV of the 36 subdivisions in
India. This figure reveals low annual rainfall over the northwestern, extreme north,
and southeastern portions (rain shadow zone), and high annual rainfall over the
northeastern and southwestern portions of the study area. However, the CV is high in
the northwestern and low in the northeastern parts of the country (Fig. 7.2).
Skewness is basically a measure of the degree of symmetry or asymmetry in any
given dataset. As per results, skewness of the Indian rainfall varied from À0.74
(Assam and Meghalaya) to 2.16 (Arunachal Pradesh), with a country mean skewness
of 0.09. Table 7.1 also shows that the data are skewed in nature because the value of
162
T. Mandal et al.
In this study, in order to estimate the percentage of change of rainfall in the second
half compared to first half of the time series, the percent bias method (Moriasi et al.
2007) was used following this formula:
PBIAS ¼ 100 À
X n
iÀ1
Yi
Xi
 100
ð7:10Þ
where P BIAS represents percent bias, n is the total extent of the subseries separately,
Xi and Yi are the values of the observational data in the first and second subseries,
respectively. The positive and negative values of P BIAS indicate an increasing and
decreasing trend in respect to first subseries.
Results and Discussion
Descriptive Analysis of Annual Rainfall
Table 7.1 depicts some statistical parameters of annual rainfall, such as mean
minimum, mean maximum, mean, standard deviation (SD), coefficient of variation
(CV), skewness (C S ), and kurtosis (C K ) of the annual rainfall of 36 meteorological
subdivisions. The average annual rainfall varied from 292.64 mm Æ 108.85 (West
Rajasthan) to 3405.96 mm Æ 481.3.97 (Coastal Karnataka), with CV of 27.20% and
14.13%, respectively, whereas the country mean rainfall is 1384.59 mm Æ 106.97.
The SD of annual rainfall varied from 108.85 (CV 37.20%) (West Rajasthan) to
485.10 (CV of 16.29%) (Kankan & Goa). The mean minimum and mean maximum
rainfall varied from 62 mm (West Rajasthan) to 2511 mm (Coastal Karnataka) and
from 769 mm (West Rajasthan) to 5554 mm (Coastal Karnataka), respectively. The
CV of the datasets indicates the medium to high variability of rainfall in the study
region as it varied from 12.02 (Assam & Meghalaya) to 40.78 (Saurashtra & Kutch).
The western and northwestern parts of India show maximum rainfall variability;
however, the annual rainfall is quite low in these parts. The other parts show
minimum rainfall variability with medium to high annual rainfall. Similarly,
Fig. 7.2 shows the annual rainfall variability and CV of the 36 subdivisions in
India. This figure reveals low annual rainfall over the northwestern, extreme north,
and southeastern portions (rain shadow zone), and high annual rainfall over the
northeastern and southwestern portions of the study area. However, the CV is high in
the northwestern and low in the northeastern parts of the country (Fig. 7.2).
Skewness is basically a measure of the degree of symmetry or asymmetry in any
given dataset. As per results, skewness of the Indian rainfall varied from À0.74
(Assam and Meghalaya) to 2.16 (Arunachal Pradesh), with a country mean skewness
of 0.09. Table 7.1 also shows that the data are skewed in nature because the value of
162
T. Mandal et al.