

adaptation preferred by respondents for extreme weather events and changes in
economic activities. The correlograms show the relationship between adaptation
strategies and the socioeconomic characteristics of the household (Figs. 5.8, 5.9, and
5.10). Negative correlation is depicted by red and blue color shows the positive
correlations. The legend color below the correlograms shows the correlation
Table 5.3 PCA-identified factors and their variance
Sample
no.
Factors
Initial eigen values
Total
Percent of
variance
1
Seawall/earthen embankment
3.003
9.384
2
Increase embankment height
2.249
7.027
3
Grass strips and mangroves replanting
1.852
5.787
4
Maintenance and improving the river bank
1.735
5.423
5
Migration to safe place
1.579
4.935
6
Transformation of land for fishery
1.398
4.369
7
Adapting of new farming techniques
1.353
4.227
8
Digging pond inside fish farm
1.325
4.139
9
Placing net around shrimp
1.303
4.071
10
Asking one’s own children to work in a field or in any
sector
1.231
3.846
11
Make community action team
1.133
3.54
12
Make higher foundation for home
1.112
3.476
13
Stone bunds
1.058
3.306
14
Stop schooling of children
1.025
3.203
Total variance explained
66.732
Source: Authors’ own calculations based on PCA analysis
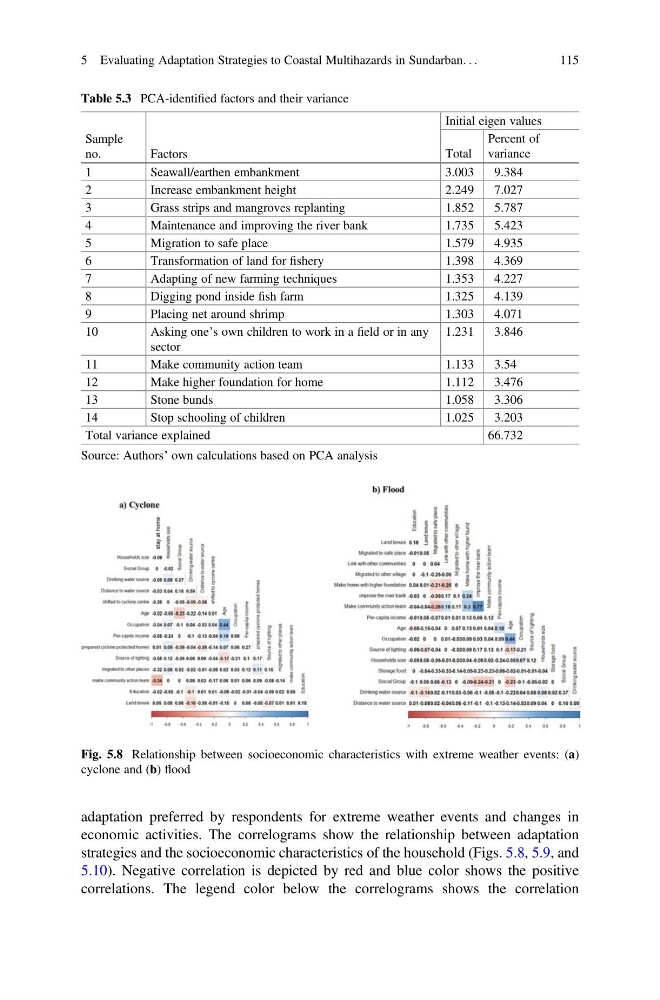
Fig. 5.8 Relationship between socioeconomic characteristics with extreme weather events: (a)
cyclone and (b) flood
5 Evaluating Adaptation Strategies to Coastal Multihazards in Sundarban. . .
115
economic activities. The correlograms show the relationship between adaptation
strategies and the socioeconomic characteristics of the household (Figs. 5.8, 5.9, and
5.10). Negative correlation is depicted by red and blue color shows the positive
correlations. The legend color below the correlograms shows the correlation
Table 5.3 PCA-identified factors and their variance
Sample
no.
Factors
Initial eigen values
Total
Percent of
variance
1
Seawall/earthen embankment
3.003
9.384
2
Increase embankment height
2.249
7.027
3
Grass strips and mangroves replanting
1.852
5.787
4
Maintenance and improving the river bank
1.735
5.423
5
Migration to safe place
1.579
4.935
6
Transformation of land for fishery
1.398
4.369
7
Adapting of new farming techniques
1.353
4.227
8
Digging pond inside fish farm
1.325
4.139
9
Placing net around shrimp
1.303
4.071
10
Asking one’s own children to work in a field or in any
sector
1.231
3.846
11
Make community action team
1.133
3.54
12
Make higher foundation for home
1.112
3.476
13
Stone bunds
1.058
3.306
14
Stop schooling of children
1.025
3.203
Total variance explained
66.732
Source: Authors’ own calculations based on PCA analysis
Fig. 5.8 Relationship between socioeconomic characteristics with extreme weather events: (a)
cyclone and (b) flood
5 Evaluating Adaptation Strategies to Coastal Multihazards in Sundarban. . .
115