

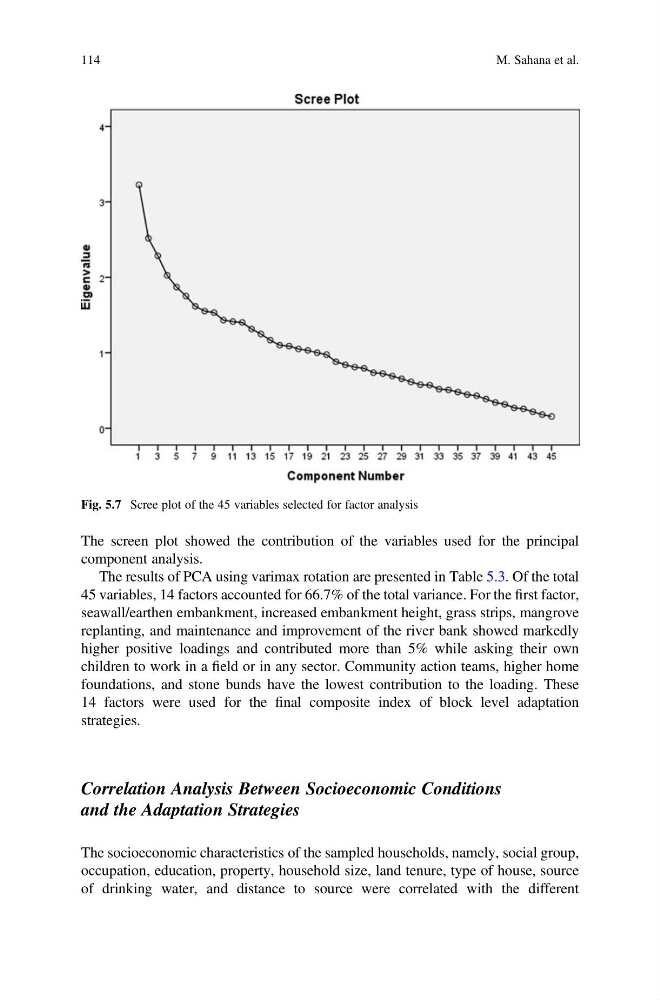
The screen plot showed the contribution of the variables used for the principal
component analysis.
The results of PCA using varimax rotation are presented in Table 5.3. Of the total
45 variables, 14 factors accounted for 66.7% of the total variance. For the first factor,
seawall/earthen embankment, increased embankment height, grass strips, mangrove
replanting, and maintenance and improvement of the river bank showed markedly
higher positive loadings and contributed more than 5% while asking their own
children to work in a field or in any sector. Community action teams, higher home
foundations, and stone bunds have the lowest contribution to the loading. These
14 factors were used for the final composite index of block level adaptation
strategies.
Correlation Analysis Between Socioeconomic Conditions
and the Adaptation Strategies
The socioeconomic characteristics of the sampled households, namely, social group,
occupation, education, property, household size, land tenure, type of house, source
of drinking water, and distance to source were correlated with the different
Fig. 5.7 Scree plot of the 45 variables selected for factor analysis
114
M. Sahana et al.
component analysis.
The results of PCA using varimax rotation are presented in Table 5.3. Of the total
45 variables, 14 factors accounted for 66.7% of the total variance. For the first factor,
seawall/earthen embankment, increased embankment height, grass strips, mangrove
replanting, and maintenance and improvement of the river bank showed markedly
higher positive loadings and contributed more than 5% while asking their own
children to work in a field or in any sector. Community action teams, higher home
foundations, and stone bunds have the lowest contribution to the loading. These
14 factors were used for the final composite index of block level adaptation
strategies.
Correlation Analysis Between Socioeconomic Conditions
and the Adaptation Strategies
The socioeconomic characteristics of the sampled households, namely, social group,
occupation, education, property, household size, land tenure, type of house, source
of drinking water, and distance to source were correlated with the different
Fig. 5.7 Scree plot of the 45 variables selected for factor analysis
114
M. Sahana et al.