

5.4 Results and Discussion
165
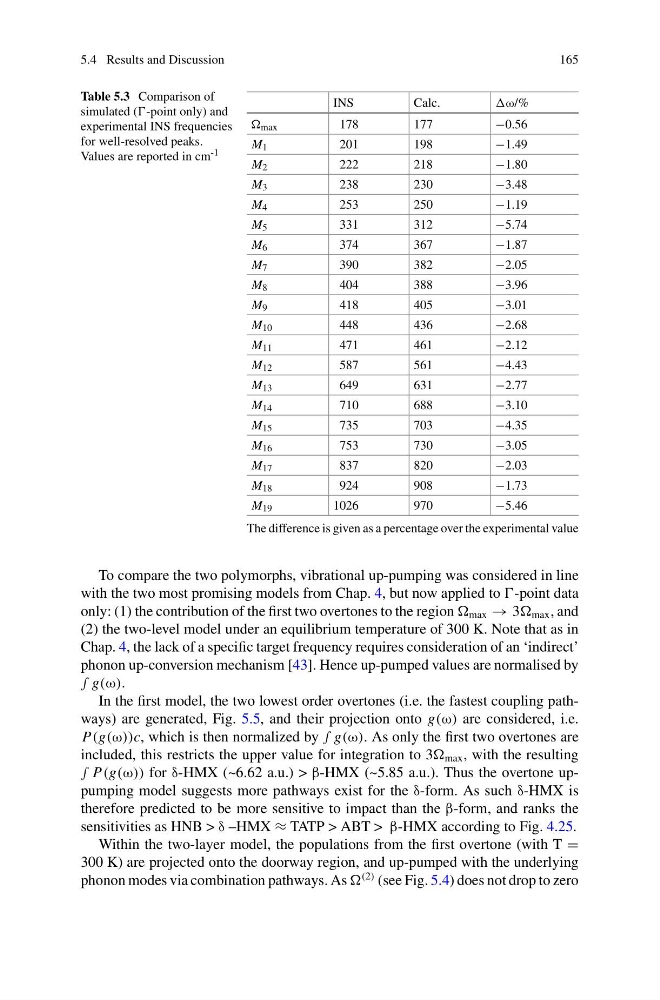
Table 5.3 Comparison of
simulated (-point only) and
experimental INS frequencies
for well-resolved peaks.
Values are reported in cm -1
INS
Calc.
ω/%
max
178
177
−0.56
M 1
201
198
−1.49
M 2
222
218
−1.80
M 3
238
230
−3.48
M 4
253
250
−1.19
M 5
331
312
−5.74
M 6
374
367
−1.87
M 7
390
382
−2.05
M 8
404
388
−3.96
M 9
418
405
−3.01
M 10
448
436
−2.68
M 11
471
461
−2.12
M 12
587
561
−4.43
M 13
649
631
−2.77
M 14
710
688
−3.10
M 15
735
703
−4.35
M 16
753
730
−3.05
M 17
837
820
−2.03
M 18
924
908
−1.73
M 19
1026
970
−5.46
The difference is given as a percentage over the experimental value
To compare the two polymorphs, vibrational up-pumping was considered in line
with the two most promising models from Chap. 4, but now applied to -point data
only: (1) the contribution of the first two overtones to the region max → 3 max , and
(2) the two-level model under an equilibrium temperature of 300 K. Note that as in
Chap. 4, the lack of a specific target frequency requires consideration of an ‘indirect’
phonon up-conversion mechanism [43]. Hence up-pumped values are normalised by
∫ g(ω).
In the first model, the two lowest order overtones (i.e. the fastest coupling pathways) are generated, Fig. 5.5, and their projection onto g(ω) are considered, i.e.
P(g(ω))c, which is then normalized by ∫ g(ω). As only the first two overtones are
included, this restricts the upper value for integration to 3 max , with the resulting
∫ P(g(ω)) for δ-HMX (~6.62 a.u.) > β-HMX (~5.85 a.u.). Thus the overtone uppumping model suggests more pathways exist for the δ-form. As such δ-HMX is
therefore predicted to be more sensitive to impact than the β-form, and ranks the
sensitivities as HNB > δ –HMX ≈ TATP > ABT > β-HMX according to Fig. 4.25.
Within the two-layer model, the populations from the first overtone (with T =
300 K) are projected onto the doorway region, and up-pumped with the underlying
phonon modes via combination pathways. As
(2) (see Fig. 5.4) does not drop to zero
165
Table 5.3 Comparison of
simulated (-point only) and
experimental INS frequencies
for well-resolved peaks.
Values are reported in cm -1
INS
Calc.
ω/%
max
178
177
−0.56
M 1
201
198
−1.49
M 2
222
218
−1.80
M 3
238
230
−3.48
M 4
253
250
−1.19
M 5
331
312
−5.74
M 6
374
367
−1.87
M 7
390
382
−2.05
M 8
404
388
−3.96
M 9
418
405
−3.01
M 10
448
436
−2.68
M 11
471
461
−2.12
M 12
587
561
−4.43
M 13
649
631
−2.77
M 14
710
688
−3.10
M 15
735
703
−4.35
M 16
753
730
−3.05
M 17
837
820
−2.03
M 18
924
908
−1.73
M 19
1026
970
−5.46
The difference is given as a percentage over the experimental value
To compare the two polymorphs, vibrational up-pumping was considered in line
with the two most promising models from Chap. 4, but now applied to -point data
only: (1) the contribution of the first two overtones to the region max → 3 max , and
(2) the two-level model under an equilibrium temperature of 300 K. Note that as in
Chap. 4, the lack of a specific target frequency requires consideration of an ‘indirect’
phonon up-conversion mechanism [43]. Hence up-pumped values are normalised by
∫ g(ω).
In the first model, the two lowest order overtones (i.e. the fastest coupling pathways) are generated, Fig. 5.5, and their projection onto g(ω) are considered, i.e.
P(g(ω))c, which is then normalized by ∫ g(ω). As only the first two overtones are
included, this restricts the upper value for integration to 3 max , with the resulting
∫ P(g(ω)) for δ-HMX (~6.62 a.u.) > β-HMX (~5.85 a.u.). Thus the overtone uppumping model suggests more pathways exist for the δ-form. As such δ-HMX is
therefore predicted to be more sensitive to impact than the β-form, and ranks the
sensitivities as HNB > δ –HMX ≈ TATP > ABT > β-HMX according to Fig. 4.25.
Within the two-layer model, the populations from the first overtone (with T =
300 K) are projected onto the doorway region, and up-pumped with the underlying
phonon modes via combination pathways. As
(2) (see Fig. 5.4) does not drop to zero