

164
5 Vibrational Up-Pumping in Polymorphic Materials
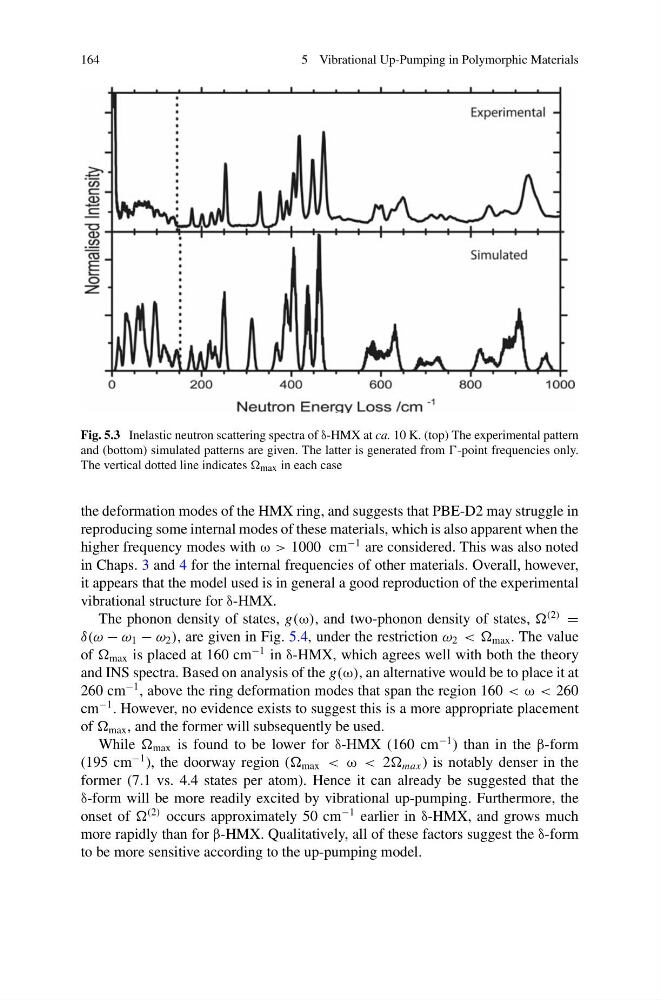
Fig. 5.3 Inelastic neutron scattering spectra of δ-HMX at ca. 10 K. (top) The experimental pattern
and (bottom) simulated patterns are given. The latter is generated from -point frequencies only.
The vertical dotted line indicates max in each case
the deformation modes of the HMX ring, and suggests that PBE-D2 may struggle in
reproducing some internal modes of these materials, which is also apparent when the
higher frequency modes with ω > 1000 cm
−1 are considered. This was also noted
in Chaps. 3 and 4 for the internal frequencies of other materials. Overall, however,
it appears that the model used is in general a good reproduction of the experimental
vibrational structure for δ-HMX.
The phonon density of states, g(ω), and two-phonon density of states,
(2)
=
δ(ω − ω 1 − ω 2 ), are given in Fig. 5.4, under the restriction ω 2 < < max . The value
of max is placed at 160 cm
−1 in δ-HMX, which agrees well with both the theory
and INS spectra. Based on analysis of the g(ω), an alternative would be to place it at
260 cm
−1 , above the ring deformation modes that span the region 160 < ω < 260
cm
−1 . However, no evidence exists to suggest this is a more appropriate placement
of max , and the former will subsequently be used.
While max is found to be lower for δ-HMX (160 cm
−1 ) than in the β-form
(195 cm
−1 ), the doorway region ( max < ω < 2 max ) is notably denser in the
former (7.1 vs. 4.4 states per atom). Hence it can already be suggested that the
δ-form will be more readily excited by vibrational up-pumping. Furthermore, the
onset of
(2) occurs approximately 50 cm
−1 earlier in δ-HMX, and grows much
more rapidly than for β-HMX. Qualitatively, all of these factors suggest the δ-form
to be more sensitive according to the up-pumping model.
5 Vibrational Up-Pumping in Polymorphic Materials
Fig. 5.3 Inelastic neutron scattering spectra of δ-HMX at ca. 10 K. (top) The experimental pattern
and (bottom) simulated patterns are given. The latter is generated from -point frequencies only.
The vertical dotted line indicates max in each case
the deformation modes of the HMX ring, and suggests that PBE-D2 may struggle in
reproducing some internal modes of these materials, which is also apparent when the
higher frequency modes with ω > 1000 cm
−1 are considered. This was also noted
in Chaps. 3 and 4 for the internal frequencies of other materials. Overall, however,
it appears that the model used is in general a good reproduction of the experimental
vibrational structure for δ-HMX.
The phonon density of states, g(ω), and two-phonon density of states,
(2)
=
δ(ω − ω 1 − ω 2 ), are given in Fig. 5.4, under the restriction ω 2 < < max . The value
of max is placed at 160 cm
−1 in δ-HMX, which agrees well with both the theory
and INS spectra. Based on analysis of the g(ω), an alternative would be to place it at
260 cm
−1 , above the ring deformation modes that span the region 160 < ω < 260
cm
−1 . However, no evidence exists to suggest this is a more appropriate placement
of max , and the former will subsequently be used.
While max is found to be lower for δ-HMX (160 cm
−1 ) than in the β-form
(195 cm
−1 ), the doorway region ( max < ω < 2 max ) is notably denser in the
former (7.1 vs. 4.4 states per atom). Hence it can already be suggested that the
δ-form will be more readily excited by vibrational up-pumping. Furthermore, the
onset of
(2) occurs approximately 50 cm
−1 earlier in δ-HMX, and grows much
more rapidly than for β-HMX. Qualitatively, all of these factors suggest the δ-form
to be more sensitive according to the up-pumping model.