

5.3 Materials
163
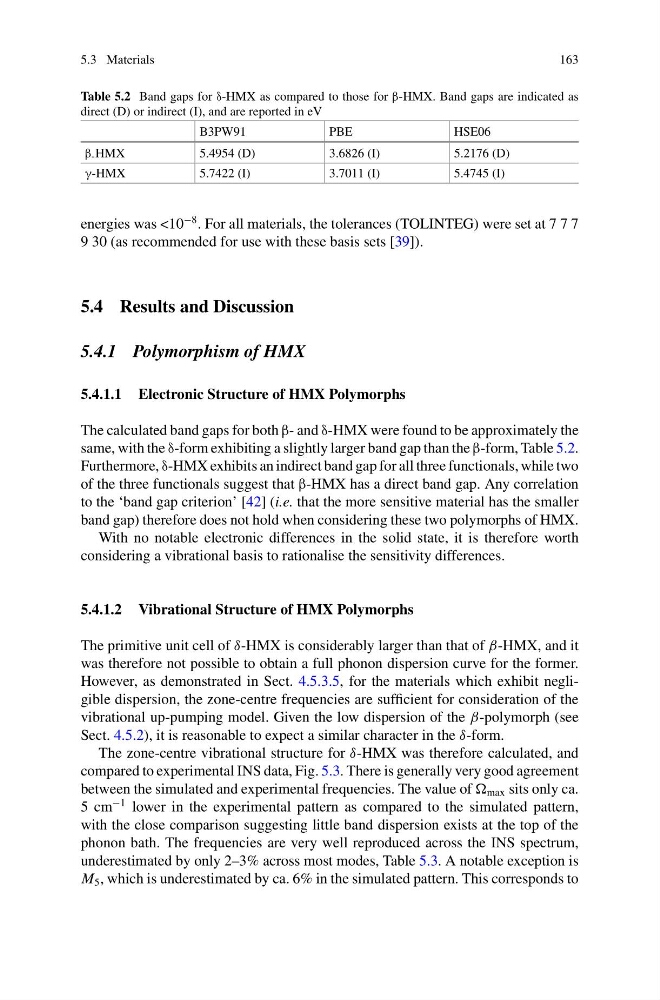
Table 5.2 Band gaps for δ-HMX as compared to those for β-HMX. Band gaps are indicated as
direct (D) or indirect (I), and are reported in eV
B3PW91
PBE
HSE06
β - HMX
5.4954 (D)
3.6826 (I)
5.2176 (D)
γ-HMX
5.7422 (I)
3.7011 (I)
5.4745 (I)
energies was <10
−8 . For all materials, the tolerances (TOLINTEG) were set at 7 7 7
9 30 (as recommended for use with these basis sets [39]).
5.4 Results and Discussion
5.4.1 Polymorphism of HMX
5.4.1.1 Electronic Structure of HMX Polymorphs
The calculated band gaps for both β- and δ-HMX were found to be approximately the
same, with the δ-form exhibiting a slightly larger band gap than the β-form, Table 5.2.
Furthermore, δ-HMX exhibits an indirect band gap for all three functionals, while two
of the three functionals suggest that β-HMX has a direct band gap. Any correlation
to the ‘band gap criterion’ [42] (i.e. that the more sensitive material has the smaller
band gap) therefore does not hold when considering these two polymorphs of HMX.
With no notable electronic differences in the solid state, it is therefore worth
considering a vibrational basis to rationalise the sensitivity differences.
5.4.1.2 Vibrational Structure of HMX Polymorphs
The primitive unit cell of δ-HMX is considerably larger than that of β-HMX, and it
was therefore not possible to obtain a full phonon dispersion curve for the former.
However, as demonstrated in Sect. 4.5.3.5, for the materials which exhibit negligible dispersion, the zone-centre frequencies are sufficient for consideration of the
vibrational up-pumping model. Given the low dispersion of the β-polymorph (see
Sect. 4.5.2), it is reasonable to expect a similar character in the δ-form.
The zone-centre vibrational structure for δ-HMX was therefore calculated, and
compared to experimental INS data, Fig. 5.3. There is generally very good agreement
between the simulated and experimental frequencies. The value of max sits only ca.
5 cm
−1 lower in the experimental pattern as compared to the simulated pattern,
with the close comparison suggesting little band dispersion exists at the top of the
phonon bath. The frequencies are very well reproduced across the INS spectrum,
underestimated by only 2–3% across most modes, Table 5.3. A notable exception is
M 5 , which is underestimated by ca. 6% in the simulated pattern. This corresponds to
163
Table 5.2 Band gaps for δ-HMX as compared to those for β-HMX. Band gaps are indicated as
direct (D) or indirect (I), and are reported in eV
B3PW91
PBE
HSE06
β - HMX
5.4954 (D)
3.6826 (I)
5.2176 (D)
γ-HMX
5.7422 (I)
3.7011 (I)
5.4745 (I)
energies was <10
−8 . For all materials, the tolerances (TOLINTEG) were set at 7 7 7
9 30 (as recommended for use with these basis sets [39]).
5.4 Results and Discussion
5.4.1 Polymorphism of HMX
5.4.1.1 Electronic Structure of HMX Polymorphs
The calculated band gaps for both β- and δ-HMX were found to be approximately the
same, with the δ-form exhibiting a slightly larger band gap than the β-form, Table 5.2.
Furthermore, δ-HMX exhibits an indirect band gap for all three functionals, while two
of the three functionals suggest that β-HMX has a direct band gap. Any correlation
to the ‘band gap criterion’ [42] (i.e. that the more sensitive material has the smaller
band gap) therefore does not hold when considering these two polymorphs of HMX.
With no notable electronic differences in the solid state, it is therefore worth
considering a vibrational basis to rationalise the sensitivity differences.
5.4.1.2 Vibrational Structure of HMX Polymorphs
The primitive unit cell of δ-HMX is considerably larger than that of β-HMX, and it
was therefore not possible to obtain a full phonon dispersion curve for the former.
However, as demonstrated in Sect. 4.5.3.5, for the materials which exhibit negligible dispersion, the zone-centre frequencies are sufficient for consideration of the
vibrational up-pumping model. Given the low dispersion of the β-polymorph (see
Sect. 4.5.2), it is reasonable to expect a similar character in the δ-form.
The zone-centre vibrational structure for δ-HMX was therefore calculated, and
compared to experimental INS data, Fig. 5.3. There is generally very good agreement
between the simulated and experimental frequencies. The value of max sits only ca.
5 cm
−1 lower in the experimental pattern as compared to the simulated pattern,
with the close comparison suggesting little band dispersion exists at the top of the
phonon bath. The frequencies are very well reproduced across the INS spectrum,
underestimated by only 2–3% across most modes, Table 5.3. A notable exception is
M 5 , which is underestimated by ca. 6% in the simulated pattern. This corresponds to