

4.5 Results and Discussion
147
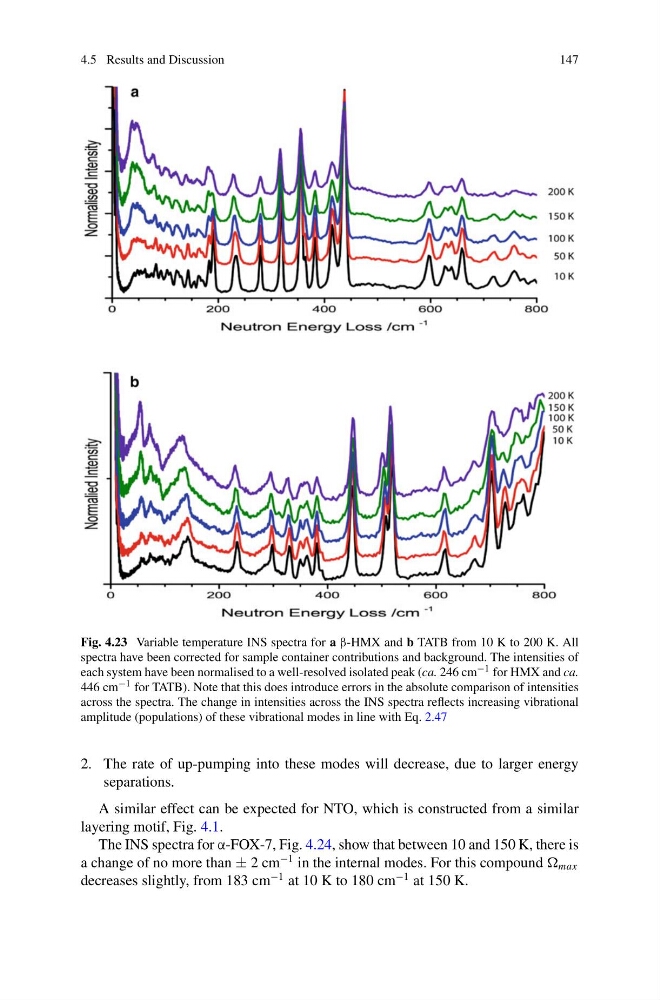
Fig. 4.23 Variable temperature INS spectra for a β-HMX and b TATB from 10 K to 200 K. All
spectra have been corrected for sample container contributions and background. The intensities of
each system have been normalised to a well-resolved isolated peak (ca. 246 cm −1 for HMX and ca.
446 cm −1 for TATB). Note that this does introduce errors in the absolute comparison of intensities
across the spectra. The change in intensities across the INS spectra reflects increasing vibrational
amplitude (populations) of these vibrational modes in line with Eq. 2.47
2. The rate of up-pumping into these modes will decrease, due to larger energy
separations.
A similar effect can be expected for NTO, which is constructed from a similar
layering motif, Fig. 4.1.
The INS spectra for α-FOX-7, Fig. 4.24, show that between 10 and 150 K, there is
a change of no more than ± 2 cm
−1 in the internal modes. For this compound max
decreases slightly, from 183 cm
−1 at 10 K to 180 cm
−1 at 150 K.
147
Fig. 4.23 Variable temperature INS spectra for a β-HMX and b TATB from 10 K to 200 K. All
spectra have been corrected for sample container contributions and background. The intensities of
each system have been normalised to a well-resolved isolated peak (ca. 246 cm −1 for HMX and ca.
446 cm −1 for TATB). Note that this does introduce errors in the absolute comparison of intensities
across the spectra. The change in intensities across the INS spectra reflects increasing vibrational
amplitude (populations) of these vibrational modes in line with Eq. 2.47
2. The rate of up-pumping into these modes will decrease, due to larger energy
separations.
A similar effect can be expected for NTO, which is constructed from a similar
layering motif, Fig. 4.1.
The INS spectra for α-FOX-7, Fig. 4.24, show that between 10 and 150 K, there is
a change of no more than ± 2 cm
−1 in the internal modes. For this compound max
decreases slightly, from 183 cm
−1 at 10 K to 180 cm
−1 at 150 K.