

146
4 Vibrational Up-Pumping in Some Molecular Energetic Materials
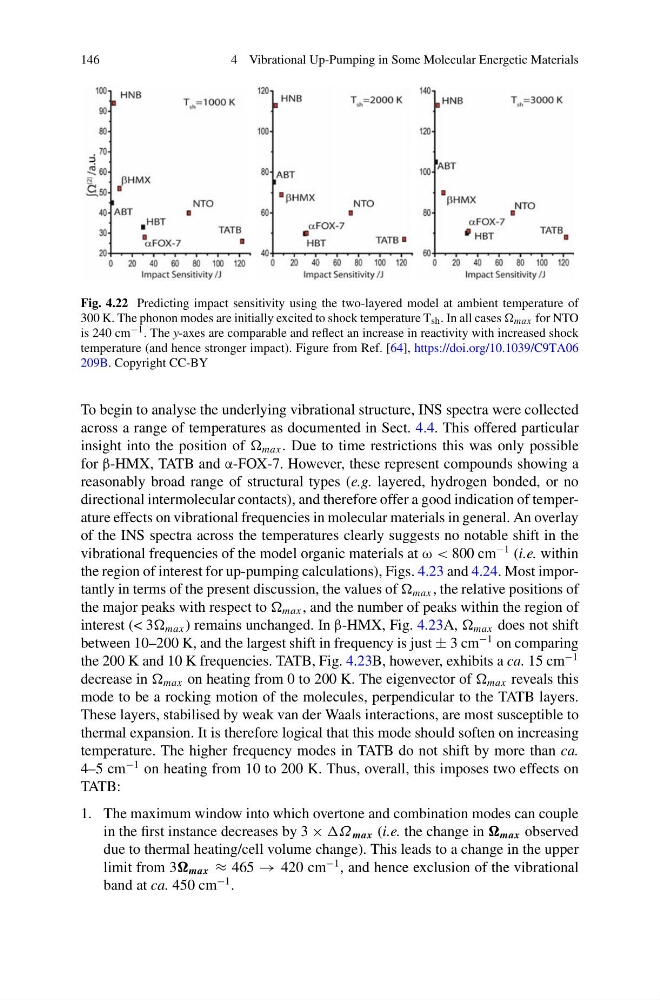
Fig. 4.22 Predicting impact sensitivity using the two-layered model at ambient temperature of
300 K. The phonon modes are initially excited to shock temperature T sh . In all cases max for NTO
is 240 cm −1 . The y-axes are comparable and reflect an increase in reactivity with increased shock
temperature (and hence stronger impact). Figure from Ref. [64], https://doi.org/10.1039/C9TA06
209B. Copyright CC-BY
To begin to analyse the underlying vibrational structure, INS spectra were collected
across a range of temperatures as documented in Sect. 4.4. This offered particular
insight into the position of max . Due to time restrictions this was only possible
for β-HMX, TATB and α-FOX-7. However, these represent compounds showing a
reasonably broad range of structural types (e.g. layered, hydrogen bonded, or no
directional intermolecular contacts), and therefore offer a good indication of temperature effects on vibrational frequencies in molecular materials in general. An overlay
of the INS spectra across the temperatures clearly suggests no notable shift in the
vibrational frequencies of the model organic materials at ω < 800 cm
−1 (i.e. within
the region of interest for up-pumping calculations), Figs. 4.23 and 4.24. Most importantly in terms of the present discussion, the values of max , the relative positions of
the major peaks with respect to max , and the number of peaks within the region of
interest (< 3 max ) remains unchanged. In β-HMX, Fig. 4.23A, max does not shift
between 10–200 K, and the largest shift in frequency is just ± 3 cm
−1 on comparing
the 200 K and 10 K frequencies. TATB, Fig. 4.23B, however, exhibits a ca. 15 cm
−1
decrease in max on heating from 0 to 200 K. The eigenvector of max reveals this
mode to be a rocking motion of the molecules, perpendicular to the TATB layers.
These layers, stabilised by weak van der Waals interactions, are most susceptible to
thermal expansion. It is therefore logical that this mode should soften on increasing
temperature. The higher frequency modes in TATB do not shift by more than ca.
4–5 cm
−1 on heating from 10 to 200 K. Thus, overall, this imposes two effects on
TATB:
1. The maximum window into which overtone and combination modes can couple
in the first instance decreases by 3 × Ω max (i.e. the change in max observed
due to thermal heating/cell volume change). This leads to a change in the upper
limit from 3 max ≈ 465 → 420 cm
−1 , and hence exclusion of the vibrational
band at ca. 450 cm
−1 .
4 Vibrational Up-Pumping in Some Molecular Energetic Materials
Fig. 4.22 Predicting impact sensitivity using the two-layered model at ambient temperature of
300 K. The phonon modes are initially excited to shock temperature T sh . In all cases max for NTO
is 240 cm −1 . The y-axes are comparable and reflect an increase in reactivity with increased shock
temperature (and hence stronger impact). Figure from Ref. [64], https://doi.org/10.1039/C9TA06
209B. Copyright CC-BY
To begin to analyse the underlying vibrational structure, INS spectra were collected
across a range of temperatures as documented in Sect. 4.4. This offered particular
insight into the position of max . Due to time restrictions this was only possible
for β-HMX, TATB and α-FOX-7. However, these represent compounds showing a
reasonably broad range of structural types (e.g. layered, hydrogen bonded, or no
directional intermolecular contacts), and therefore offer a good indication of temperature effects on vibrational frequencies in molecular materials in general. An overlay
of the INS spectra across the temperatures clearly suggests no notable shift in the
vibrational frequencies of the model organic materials at ω < 800 cm
−1 (i.e. within
the region of interest for up-pumping calculations), Figs. 4.23 and 4.24. Most importantly in terms of the present discussion, the values of max , the relative positions of
the major peaks with respect to max , and the number of peaks within the region of
interest (< 3 max ) remains unchanged. In β-HMX, Fig. 4.23A, max does not shift
between 10–200 K, and the largest shift in frequency is just ± 3 cm
−1 on comparing
the 200 K and 10 K frequencies. TATB, Fig. 4.23B, however, exhibits a ca. 15 cm
−1
decrease in max on heating from 0 to 200 K. The eigenvector of max reveals this
mode to be a rocking motion of the molecules, perpendicular to the TATB layers.
These layers, stabilised by weak van der Waals interactions, are most susceptible to
thermal expansion. It is therefore logical that this mode should soften on increasing
temperature. The higher frequency modes in TATB do not shift by more than ca.
4–5 cm
−1 on heating from 10 to 200 K. Thus, overall, this imposes two effects on
TATB:
1. The maximum window into which overtone and combination modes can couple
in the first instance decreases by 3 × Ω max (i.e. the change in max observed
due to thermal heating/cell volume change). This leads to a change in the upper
limit from 3 max ≈ 465 → 420 cm
−1 , and hence exclusion of the vibrational
band at ca. 450 cm
−1 .