

3.5 Results and Discussion
89
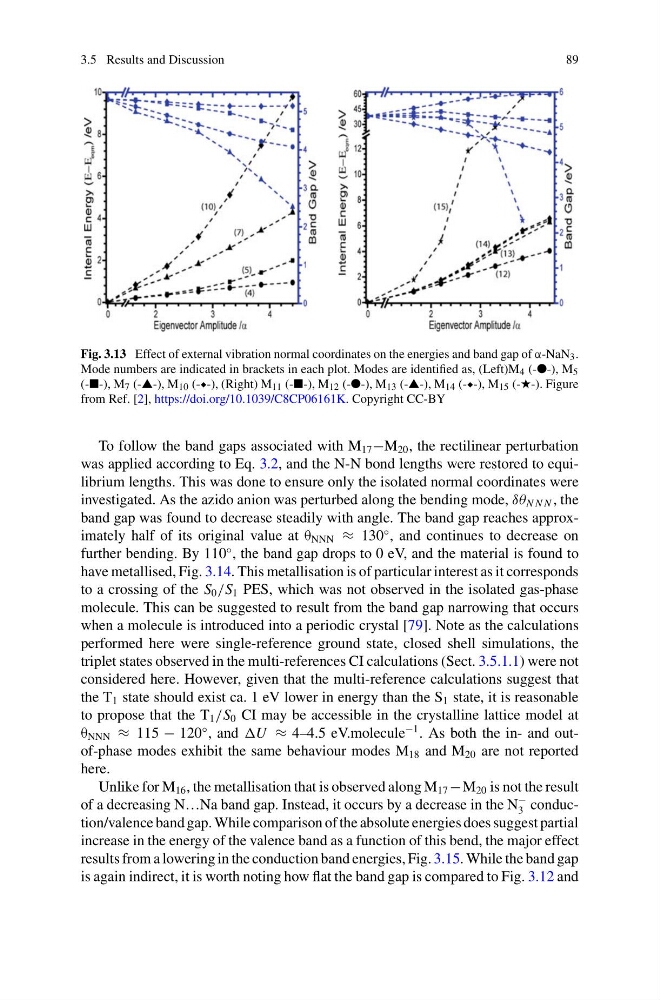
Fig. 3.13 Effect of external vibration normal coordinates on the energies and band gap of α-NaN 3 .
Mode numbers are indicated in brackets in each plot. Modes are identified as, (Left)M 4 (-●-), M 5
(--), M 7 (-▲-), M 10 (-˛-), (Right) M 11 (--), M 12 (-●-), M 13 (-▲-), M 14 (-˛-), M 15 (-★-). Figure
from Ref. [2], https://doi.org/10.1039/C8CP06161K. Copyright CC-BY
To follow the band gaps associated with M 17 −M 20 , the rectilinear perturbation
was applied according to Eq. 3.2, and the N-N bond lengths were restored to equilibrium lengths. This was done to ensure only the isolated normal coordinates were
investigated. As the azido anion was perturbed along the bending mode, δθ N N N , the
band gap was found to decrease steadily with angle. The band gap reaches approximately half of its original value at θ NNN ≈ 130
◦ , and continues to decrease on
further bending. By 110
◦ , the band gap drops to 0 eV, and the material is found to
have metallised, Fig. 3.14. This metallisation is of particular interest as it corresponds
to a crossing of the S 0 /S 1 PES, which was not observed in the isolated gas-phase
molecule. This can be suggested to result from the band gap narrowing that occurs
when a molecule is introduced into a periodic crystal [79]. Note as the calculations
performed here were single-reference ground state, closed shell simulations, the
triplet states observed in the multi-references CI calculations (Sect. 3.5.1.1) were not
considered here. However, given that the multi-reference calculations suggest that
the T 1 state should exist ca. 1 eV lower in energy than the S 1 state, it is reasonable
to propose that the T 1 /S 0 CI may be accessible in the crystalline lattice model at
θ NNN ≈ 115 − 120
◦ , and U ≈ 4–4.5 eV.molecule
−1 . As both the in- and outof-phase modes exhibit the same behaviour modes M 18 and M 20 are not reported
here.
Unlike for M 16 , the metallisation that is observed along M 17 −M 20 is not the result
of a decreasing N…Na band gap. Instead, it occurs by a decrease in the N
−
3 conduction/valence band gap. While comparison of the absolute energies does suggest partial
increase in the energy of the valence band as a function of this bend, the major effect
results from a lowering in the conduction band energies, Fig. 3.15. While the band gap
is again indirect, it is worth noting how flat the band gap is compared to Fig. 3.12 and
89
Fig. 3.13 Effect of external vibration normal coordinates on the energies and band gap of α-NaN 3 .
Mode numbers are indicated in brackets in each plot. Modes are identified as, (Left)M 4 (-●-), M 5
(--), M 7 (-▲-), M 10 (-˛-), (Right) M 11 (--), M 12 (-●-), M 13 (-▲-), M 14 (-˛-), M 15 (-★-). Figure
from Ref. [2], https://doi.org/10.1039/C8CP06161K. Copyright CC-BY
To follow the band gaps associated with M 17 −M 20 , the rectilinear perturbation
was applied according to Eq. 3.2, and the N-N bond lengths were restored to equilibrium lengths. This was done to ensure only the isolated normal coordinates were
investigated. As the azido anion was perturbed along the bending mode, δθ N N N , the
band gap was found to decrease steadily with angle. The band gap reaches approximately half of its original value at θ NNN ≈ 130
◦ , and continues to decrease on
further bending. By 110
◦ , the band gap drops to 0 eV, and the material is found to
have metallised, Fig. 3.14. This metallisation is of particular interest as it corresponds
to a crossing of the S 0 /S 1 PES, which was not observed in the isolated gas-phase
molecule. This can be suggested to result from the band gap narrowing that occurs
when a molecule is introduced into a periodic crystal [79]. Note as the calculations
performed here were single-reference ground state, closed shell simulations, the
triplet states observed in the multi-references CI calculations (Sect. 3.5.1.1) were not
considered here. However, given that the multi-reference calculations suggest that
the T 1 state should exist ca. 1 eV lower in energy than the S 1 state, it is reasonable
to propose that the T 1 /S 0 CI may be accessible in the crystalline lattice model at
θ NNN ≈ 115 − 120
◦ , and U ≈ 4–4.5 eV.molecule
−1 . As both the in- and outof-phase modes exhibit the same behaviour modes M 18 and M 20 are not reported
here.
Unlike for M 16 , the metallisation that is observed along M 17 −M 20 is not the result
of a decreasing N…Na band gap. Instead, it occurs by a decrease in the N
−
3 conduction/valence band gap. While comparison of the absolute energies does suggest partial
increase in the energy of the valence band as a function of this bend, the major effect
results from a lowering in the conduction band energies, Fig. 3.15. While the band gap
is again indirect, it is worth noting how flat the band gap is compared to Fig. 3.12 and