

88
3 Vibrational Up-Pumping: Predicting Impact Sensitivity of Some …
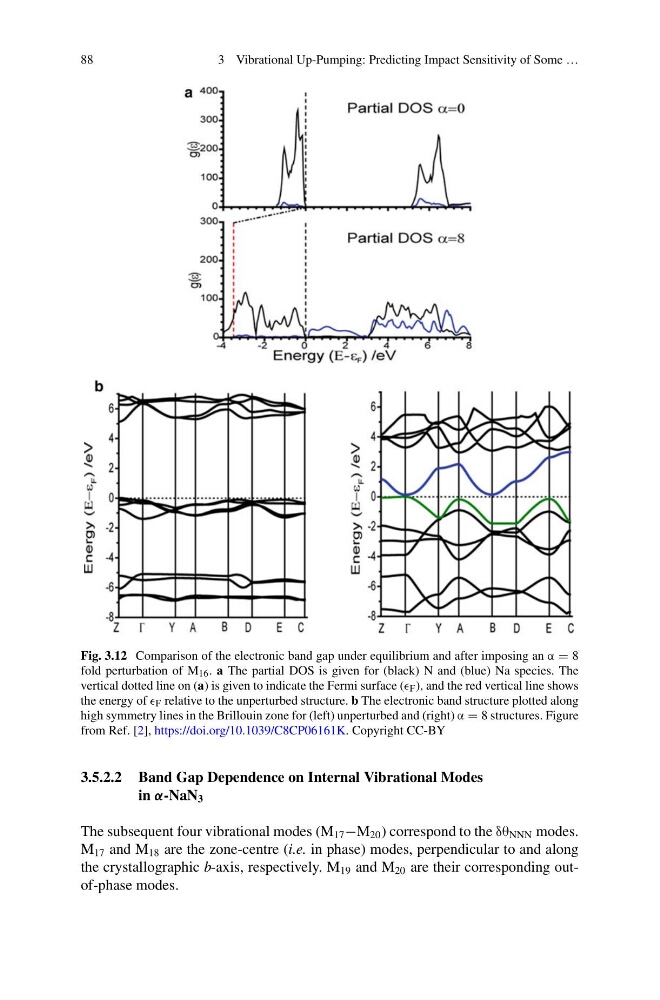
Fig. 3.12 Comparison of the electronic band gap under equilibrium and after imposing an α = 8
fold perturbation of M 16 . a The partial DOS is given for (black) N and (blue) Na species. The
vertical dotted line on (a) is given to indicate the Fermi surface ( F ), and the red vertical line shows
the energy of F relative to the unperturbed structure. b The electronic band structure plotted along
high symmetry lines in the Brillouin zone for (left) unperturbed and (right) α = 8 structures. Figure
from Ref. [2], https://doi.org/10.1039/C8CP06161K. Copyright CC-BY
3.5.2.2 Band Gap Dependence on Internal Vibrational Modes
in α-NaN 3
The subsequent four vibrational modes (M 17 −M 20 ) correspond to the δθ NNN modes.
M 17 and M 18 are the zone-centre (i.e. in phase) modes, perpendicular to and along
the crystallographic b-axis, respectively. M 19 and M 20 are their corresponding outof-phase modes.
3 Vibrational Up-Pumping: Predicting Impact Sensitivity of Some …
Fig. 3.12 Comparison of the electronic band gap under equilibrium and after imposing an α = 8
fold perturbation of M 16 . a The partial DOS is given for (black) N and (blue) Na species. The
vertical dotted line on (a) is given to indicate the Fermi surface ( F ), and the red vertical line shows
the energy of F relative to the unperturbed structure. b The electronic band structure plotted along
high symmetry lines in the Brillouin zone for (left) unperturbed and (right) α = 8 structures. Figure
from Ref. [2], https://doi.org/10.1039/C8CP06161K. Copyright CC-BY
3.5.2.2 Band Gap Dependence on Internal Vibrational Modes
in α-NaN 3
The subsequent four vibrational modes (M 17 −M 20 ) correspond to the δθ NNN modes.
M 17 and M 18 are the zone-centre (i.e. in phase) modes, perpendicular to and along
the crystallographic b-axis, respectively. M 19 and M 20 are their corresponding outof-phase modes.