

fluorescence intensity of fragments containing the labeled primer (terminal fragment
lengths) observed as peaks. Variation in the presence and location of restriction sites
results in different species having terminal fragments of different lengths. In
T-RFLP, as used by Liu and colleagues, a single fluorescent label and a single
restriction digest are used. The number of peaks and the similarity of peak profiles
across samples are then analyzed (Dollhopf et al. 2001; Edel-Hermann et al. 2004;
Mummey et al. 2005). Aliquots of the amplified DNA were digested with restriction
endonucleases to obtain ITS-RFLPs; each sample was digested with Hae III and
HhaI (Promega Corporation, Madison, WI, USA).
3.2.1.4 Statistical Analyses
Mesofaunal Diversity
Diversity of mesofauna was estimated using two indices, the Shannon–Wiener
diversity index (Hill 1973) and the inverse Simpson index (Simpson 1949). The
number of individuals of each mesofaunal order was used to indicate species
abundance and the number of identified orders to indicate species richness.
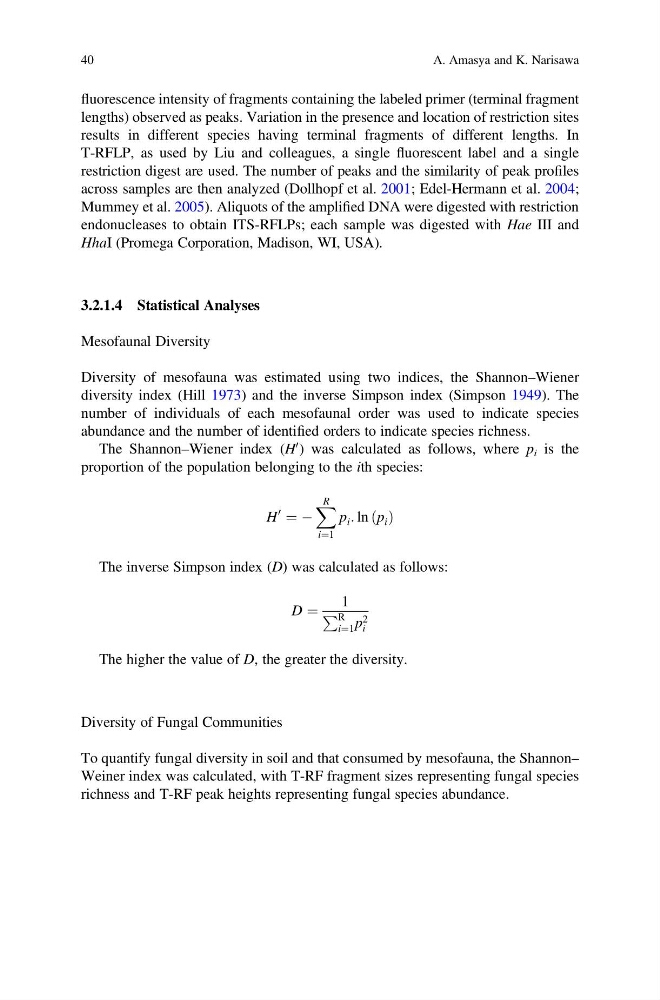
The Shannon–Wiener index (H
0 ) was calculated as follows, where p i is the
proportion of the population belonging to the ith species:
H
0
¼ À
X R
i¼1
p i : ln p i
ð Þ
The inverse Simpson index (D) was calculated as follows:
D ¼
1
P R
i¼1 p 2
i
The higher the value of D, the greater the diversity.
Diversity of Fungal Communities
To quantify fungal diversity in soil and that consumed by mesofauna, the Shannon–
Weiner index was calculated, with T-RF fragment sizes representing fungal species
richness and T-RF peak heights representing fungal species abundance.
40
A. Amasya and K. Narisawa
lengths) observed as peaks. Variation in the presence and location of restriction sites
results in different species having terminal fragments of different lengths. In
T-RFLP, as used by Liu and colleagues, a single fluorescent label and a single
restriction digest are used. The number of peaks and the similarity of peak profiles
across samples are then analyzed (Dollhopf et al. 2001; Edel-Hermann et al. 2004;
Mummey et al. 2005). Aliquots of the amplified DNA were digested with restriction
endonucleases to obtain ITS-RFLPs; each sample was digested with Hae III and
HhaI (Promega Corporation, Madison, WI, USA).
3.2.1.4 Statistical Analyses
Mesofaunal Diversity
Diversity of mesofauna was estimated using two indices, the Shannon–Wiener
diversity index (Hill 1973) and the inverse Simpson index (Simpson 1949). The
number of individuals of each mesofaunal order was used to indicate species
abundance and the number of identified orders to indicate species richness.
The Shannon–Wiener index (H
0 ) was calculated as follows, where p i is the
proportion of the population belonging to the ith species:
H
0
¼ À
X R
i¼1
p i : ln p i
ð Þ
The inverse Simpson index (D) was calculated as follows:
D ¼
1
P R
i¼1 p 2
i
The higher the value of D, the greater the diversity.
Diversity of Fungal Communities
To quantify fungal diversity in soil and that consumed by mesofauna, the Shannon–
Weiner index was calculated, with T-RF fragment sizes representing fungal species
richness and T-RF peak heights representing fungal species abundance.
40
A. Amasya and K. Narisawa