

such as loess (Haasse et al. 1989). The climate is sub-Atlantic to subcontinental. The
western slope of the Harz range is more strongly influenced by the oceanic climate,
whereas the eastern side shows a typical montane pattern of precipitation and
temperature. Mainly due to the Luv–Lee effect, annual total precipitation decreases
from west (>1000 mm) to east (<600 mm) and is greatest near Mt. Brocken
(1700 mm). The mean annual temperature increases from west (3–4
C) to east
(7–8
C) (Hanle 1995). Native vegetation is limited to a few small areas, as large
areas have been altered by human activities in recent centuries, and these areas have
been reforested with coniferous trees such as Pinus Sylvestris and Picea abies.
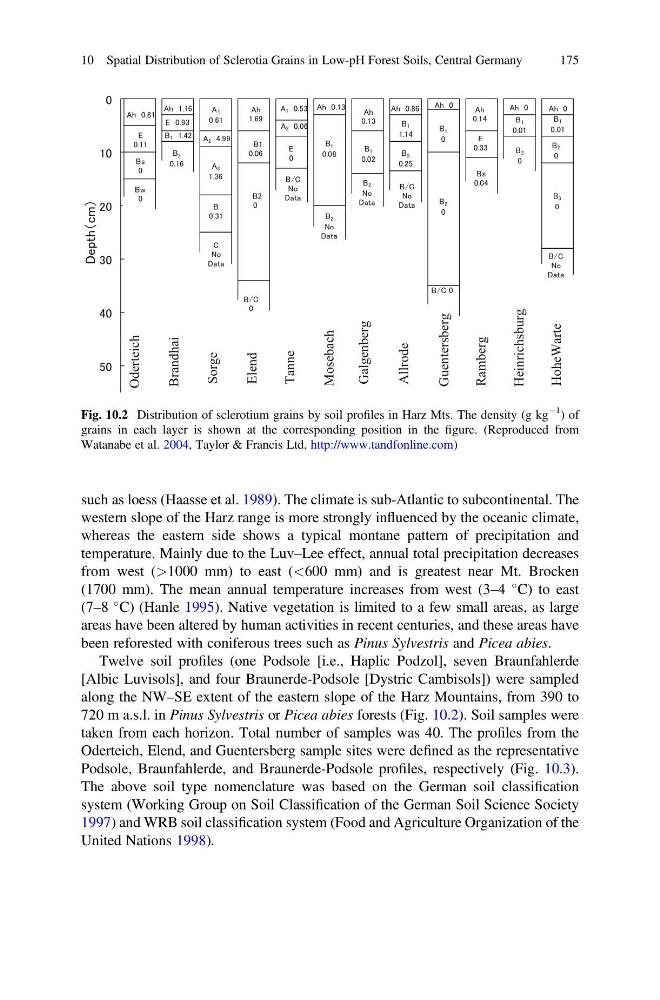
Twelve soil profiles (one Podsole [i.e., Haplic Podzol], seven Braunfahlerde
[Albic Luvisols], and four Braunerde-Podsole [Dystric Cambisols]) were sampled
along the NW–SE extent of the eastern slope of the Harz Mountains, from 390 to
720 m a.s.l. in Pinus Sylvestris or Picea abies forests (Fig. 10.2). Soil samples were
taken from each horizon. Total number of samples was 40. The profiles from the
Oderteich, Elend, and Guentersberg sample sites were defined as the representative
Podsole, Braunfahlerde, and Braunerde-Podsole profiles, respectively (Fig. 10.3).
The above soil type nomenclature was based on the German soil classification
system (Working Group on Soil Classification of the German Soil Science Society
1997) and WRB soil classification system (Food and Agriculture Organization of the
United Nations 1998).
㻜
㻝㻜
㻞㻜
㻟㻜
㻠㻜
㻡㻜
㻰㼑㼜㼠㼔䠄㼏㼙䠅
Oderteich
Brandhai
Sorge
Tanne
Elend
Heinrichsburg
Ramberg
Allrode
Galgenberg
Mosebach
㻭㼔 㻜㻚㻤㻝
㻱
㻜㻚㻝㻝
㻮㼟
㻜
㻮㼣
㻜
㻭䠍
㻜㻚㻢㻝
㻭㻟
㻝㻚㻟㻢
㻮
㻜㻚㻟㻝
㻯
㻺㼛
㻰㼍㼠㼍
㻭㼔
㻝㻚㻢㻥
㻮㻝
㻜㻚㻜㻢
㻮㻞
㻜
㻭㻝 㻜㻚㻡㻟
㻭㻞 㻜㻚㻜㻢
㻱
㻜
㻮㻛㻯
㻺㼛
㻰㼍㼠㼍
㻮㻝
㻜㻚㻜㻤
㻮㻞
㻺㼛
㻰㼍㼠㼍
㻭㼔
㻜㻚㻝㻟
㻮㻝
㻜㻚㻜㻞
㻮㻞
㻺㼛
㻰㼍㼠㼍
㻭㼔 㻜㻚㻤㻢
㻮㻝
㻝㻚㻝㻠
㻮㻞
㻜㻚㻞㻡
㻮㻛㻯
㻺㼛
㻰㼍㼠㼍
㻭㼔 㻜
㻮㻝
㻜
㻮㻞
㻜
㻮㻛㻯 㻜
㻭㼔
㻜㻚㻝㻠
㻱
㻜㻚㻟㻟
㻮㼟
㻜㻚㻜㻠
㻭㼔 㻜
㻮㻝
㻜㻚㻜㻝
㻮㻞
㻜
㻭㼔 㻜
㻮㻝
㻜㻚㻜㻝
㻮㻞
㻜
㻮㻟
㻜
HoheWarte
㻮㻞
㻜㻚㻝㻢
㻭㻞 㻠㻚㻥㻥
㻭㼔 㻝㻚㻝㻢
㻱 㻜㻚㻥㻟
㻮㻝 㻝㻚㻠㻞
㻭㼔 㻜㻚㻝㻟
㻮㻛㻯
㻺㼛
㻰㼍㼠㼍
㻮㻛㻯
㻜
Guentersberg
Fig. 10.2 Distribution of sclerotium grains by soil profiles in Harz Mts. The density (g kg
À1
) of
grains in each layer is shown at the corresponding position in the figure. (Reproduced from
Watanabe et al. 2004, Taylor & Francis Ltd, http://www.tandfonline.com)
10 Spatial Distribution of Sclerotia Grains in Low-pH Forest Soils, Central Germany
175
western slope of the Harz range is more strongly influenced by the oceanic climate,
whereas the eastern side shows a typical montane pattern of precipitation and
temperature. Mainly due to the Luv–Lee effect, annual total precipitation decreases
from west (>1000 mm) to east (<600 mm) and is greatest near Mt. Brocken
(1700 mm). The mean annual temperature increases from west (3–4
C) to east
(7–8
C) (Hanle 1995). Native vegetation is limited to a few small areas, as large
areas have been altered by human activities in recent centuries, and these areas have
been reforested with coniferous trees such as Pinus Sylvestris and Picea abies.
Twelve soil profiles (one Podsole [i.e., Haplic Podzol], seven Braunfahlerde
[Albic Luvisols], and four Braunerde-Podsole [Dystric Cambisols]) were sampled
along the NW–SE extent of the eastern slope of the Harz Mountains, from 390 to
720 m a.s.l. in Pinus Sylvestris or Picea abies forests (Fig. 10.2). Soil samples were
taken from each horizon. Total number of samples was 40. The profiles from the
Oderteich, Elend, and Guentersberg sample sites were defined as the representative
Podsole, Braunfahlerde, and Braunerde-Podsole profiles, respectively (Fig. 10.3).
The above soil type nomenclature was based on the German soil classification
system (Working Group on Soil Classification of the German Soil Science Society
1997) and WRB soil classification system (Food and Agriculture Organization of the
United Nations 1998).
㻜
㻝㻜
㻞㻜
㻟㻜
㻠㻜
㻡㻜
㻰㼑㼜㼠㼔䠄㼏㼙䠅
Oderteich
Brandhai
Sorge
Tanne
Elend
Heinrichsburg
Ramberg
Allrode
Galgenberg
Mosebach
㻭㼔 㻜㻚㻤㻝
㻱
㻜㻚㻝㻝
㻮㼟
㻜
㻮㼣
㻜
㻭䠍
㻜㻚㻢㻝
㻭㻟
㻝㻚㻟㻢
㻮
㻜㻚㻟㻝
㻯
㻺㼛
㻰㼍㼠㼍
㻭㼔
㻝㻚㻢㻥
㻮㻝
㻜㻚㻜㻢
㻮㻞
㻜
㻭㻝 㻜㻚㻡㻟
㻭㻞 㻜㻚㻜㻢
㻱
㻜
㻮㻛㻯
㻺㼛
㻰㼍㼠㼍
㻮㻝
㻜㻚㻜㻤
㻮㻞
㻺㼛
㻰㼍㼠㼍
㻭㼔
㻜㻚㻝㻟
㻮㻝
㻜㻚㻜㻞
㻮㻞
㻺㼛
㻰㼍㼠㼍
㻭㼔 㻜㻚㻤㻢
㻮㻝
㻝㻚㻝㻠
㻮㻞
㻜㻚㻞㻡
㻮㻛㻯
㻺㼛
㻰㼍㼠㼍
㻭㼔 㻜
㻮㻝
㻜
㻮㻞
㻜
㻮㻛㻯 㻜
㻭㼔
㻜㻚㻝㻠
㻱
㻜㻚㻟㻟
㻮㼟
㻜㻚㻜㻠
㻭㼔 㻜
㻮㻝
㻜㻚㻜㻝
㻮㻞
㻜
㻭㼔 㻜
㻮㻝
㻜㻚㻜㻝
㻮㻞
㻜
㻮㻟
㻜
HoheWarte
㻮㻞
㻜㻚㻝㻢
㻭㻞 㻠㻚㻥㻥
㻭㼔 㻝㻚㻝㻢
㻱 㻜㻚㻥㻟
㻮㻝 㻝㻚㻠㻞
㻭㼔 㻜㻚㻝㻟
㻮㻛㻯
㻺㼛
㻰㼍㼠㼍
㻮㻛㻯
㻜
Guentersberg
Fig. 10.2 Distribution of sclerotium grains by soil profiles in Harz Mts. The density (g kg
À1
) of
grains in each layer is shown at the corresponding position in the figure. (Reproduced from
Watanabe et al. 2004, Taylor & Francis Ltd, http://www.tandfonline.com)
10 Spatial Distribution of Sclerotia Grains in Low-pH Forest Soils, Central Germany
175