

8.6 Micro-CT Analysis
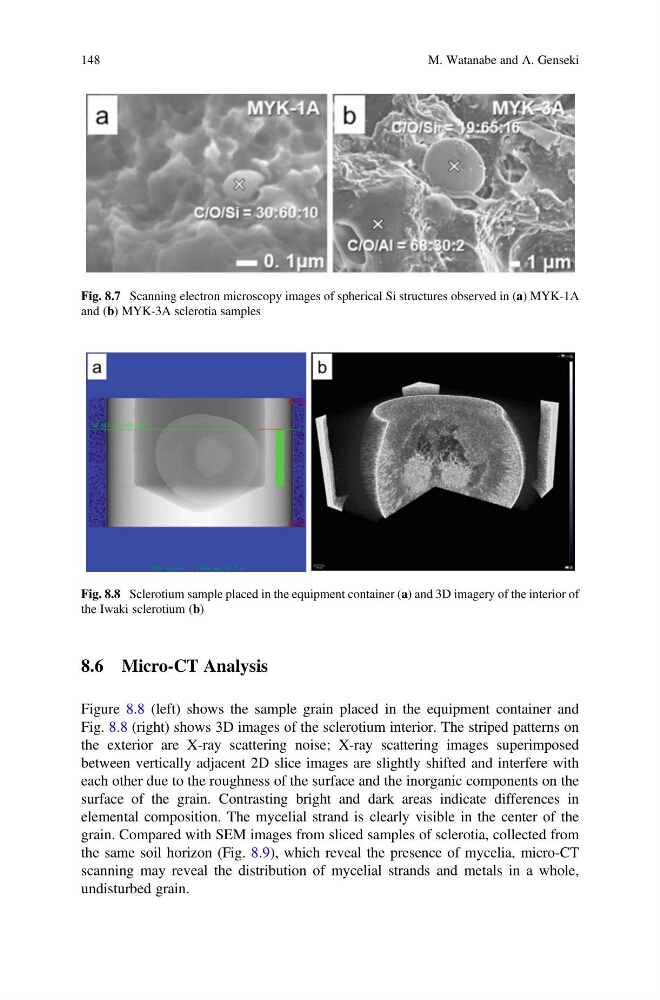
Figure 8.8 (left) shows the sample grain placed in the equipment container and
Fig. 8.8 (right) shows 3D images of the sclerotium interior. The striped patterns on
the exterior are X-ray scattering noise; X-ray scattering images superimposed
between vertically adjacent 2D slice images are slightly shifted and interfere with
each other due to the roughness of the surface and the inorganic components on the
surface of the grain. Contrasting bright and dark areas indicate differences in
elemental composition. The mycelial strand is clearly visible in the center of the
grain. Compared with SEM images from sliced samples of sclerotia, collected from
the same soil horizon (Fig. 8.9), which reveal the presence of mycelia, micro-CT
scanning may reveal the distribution of mycelial strands and metals in a whole,
undisturbed grain.
Fig. 8.7 Scanning electron microscopy images of spherical Si structures observed in (a) MYK-1A
and (b) MYK-3A sclerotia samples
Fig. 8.8 Sclerotium sample placed in the equipment container (a) and 3D imagery of the interior of
the Iwaki sclerotium (b)
148
M. Watanabe and A. Genseki
Figure 8.8 (left) shows the sample grain placed in the equipment container and
Fig. 8.8 (right) shows 3D images of the sclerotium interior. The striped patterns on
the exterior are X-ray scattering noise; X-ray scattering images superimposed
between vertically adjacent 2D slice images are slightly shifted and interfere with
each other due to the roughness of the surface and the inorganic components on the
surface of the grain. Contrasting bright and dark areas indicate differences in
elemental composition. The mycelial strand is clearly visible in the center of the
grain. Compared with SEM images from sliced samples of sclerotia, collected from
the same soil horizon (Fig. 8.9), which reveal the presence of mycelia, micro-CT
scanning may reveal the distribution of mycelial strands and metals in a whole,
undisturbed grain.
Fig. 8.7 Scanning electron microscopy images of spherical Si structures observed in (a) MYK-1A
and (b) MYK-3A sclerotia samples
Fig. 8.8 Sclerotium sample placed in the equipment container (a) and 3D imagery of the interior of
the Iwaki sclerotium (b)
148
M. Watanabe and A. Genseki