

the end. This simplification could be easily overcome by
implementing permeances dependent of temperature and
CO 2 fugacity in MPd-UOE model, updating the values for
each permeation element. However, the real operation data
used for calibration of permeances in MPx-UOE and
MPd-UOE is not enough for this purpose. Thus, other literature or experimental data could be implemented for the
adjustment of equations to correct the component permeances according to the temperature and CO 2 fugacity.
3.2.4 Sensitivity Analysis: MPx-UOE
and MPd-UOE
In this section, three sensitivity analyses are conducted:
(i) on the DT F specification for MPx-UOE; (ii) on the
number of permeation elements for MPd-UOE; and (iii) on
the DT F specification for MPd-UOE. For the sake of simplicity, MP configuration for all sensitivity analyses were
conducted in one single stage MP: for CC MPx-UOE, the
configuration chosen is one single stage from Sect. 3.2.2,
with 308,000 m
2 of permeation area; in the case of PC, both
MPx-UOE and MPd-UOE adopted one single stage from
Sect. 3.2.3, with 284,550 m
2 of permeation area.
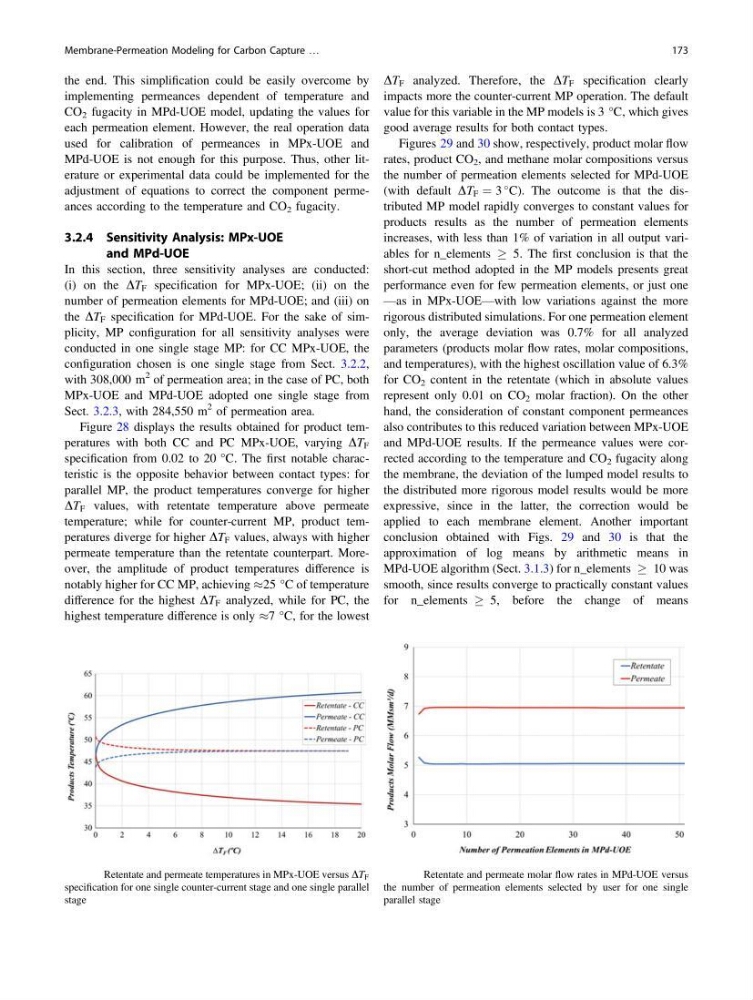
Figure 28 displays the results obtained for product temperatures with both CC and PC MPx-UOE, varying DT F
specification from 0.02 to 20 °C. The first notable characteristic is the opposite behavior between contact types: for
parallel MP, the product temperatures converge for higher
DT F values, with retentate temperature above permeate
temperature; while for counter-current MP, product temperatures diverge for higher DT F values, always with higher
permeate temperature than the retentate counterpart. Moreover, the amplitude of product temperatures difference is
notably higher for CC MP, achieving %25 °C of temperature
difference for the highest DT F analyzed, while for PC, the
highest temperature difference is only %7 °C, for the lowest
DT F analyzed. Therefore, the DT F specification clearly
impacts more the counter-current MP operation. The default
value for this variable in the MP models is 3 °C, which gives
good average results for both contact types.
Figures 29 and 30 show, respectively, product molar flow
rates, product CO 2 , and methane molar compositions versus
the number of permeation elements selected for MPd-UOE
(with default DT F ¼ 3
C). The outcome is that the distributed MP model rapidly converges to constant values for
products results as the number of permeation elements
increases, with less than 1% of variation in all output variables for n_elements ! 5. The first conclusion is that the
short-cut method adopted in the MP models presents great
performance even for few permeation elements, or just one
—as in MPx-UOE—with low variations against the more
rigorous distributed simulations. For one permeation element
only, the average deviation was 0.7% for all analyzed
parameters (products molar flow rates, molar compositions,
and temperatures), with the highest oscillation value of 6.3%
for CO 2 content in the retentate (which in absolute values
represent only 0.01 on CO 2 molar fraction). On the other
hand, the consideration of constant component permeances
also contributes to this reduced variation between MPx-UOE
and MPd-UOE results. If the permeance values were corrected according to the temperature and CO 2 fugacity along
the membrane, the deviation of the lumped model results to
the distributed more rigorous model results would be more
expressive, since in the latter, the correction would be
applied to each membrane element. Another important
conclusion obtained with Figs. 29 and 30 is that the
approximation of log means by arithmetic means in
MPd-UOE algorithm (Sect. 3.1.3) for n_elements ! 10 was
smooth, since results converge to practically constant values
for n_elements ! 5, before the change of means
Fig. 28 Retentate and permeate temperatures in MPx-UOE versus DT F
specification for one single counter-current stage and one single parallel
stage
Fig. 29 Retentate and permeate molar flow rates in MPd-UOE versus
the number of permeation elements selected by user for one single
parallel stage
Membrane-Permeation Modeling for Carbon Capture …
173
implementing permeances dependent of temperature and
CO 2 fugacity in MPd-UOE model, updating the values for
each permeation element. However, the real operation data
used for calibration of permeances in MPx-UOE and
MPd-UOE is not enough for this purpose. Thus, other literature or experimental data could be implemented for the
adjustment of equations to correct the component permeances according to the temperature and CO 2 fugacity.
3.2.4 Sensitivity Analysis: MPx-UOE
and MPd-UOE
In this section, three sensitivity analyses are conducted:
(i) on the DT F specification for MPx-UOE; (ii) on the
number of permeation elements for MPd-UOE; and (iii) on
the DT F specification for MPd-UOE. For the sake of simplicity, MP configuration for all sensitivity analyses were
conducted in one single stage MP: for CC MPx-UOE, the
configuration chosen is one single stage from Sect. 3.2.2,
with 308,000 m
2 of permeation area; in the case of PC, both
MPx-UOE and MPd-UOE adopted one single stage from
Sect. 3.2.3, with 284,550 m
2 of permeation area.
Figure 28 displays the results obtained for product temperatures with both CC and PC MPx-UOE, varying DT F
specification from 0.02 to 20 °C. The first notable characteristic is the opposite behavior between contact types: for
parallel MP, the product temperatures converge for higher
DT F values, with retentate temperature above permeate
temperature; while for counter-current MP, product temperatures diverge for higher DT F values, always with higher
permeate temperature than the retentate counterpart. Moreover, the amplitude of product temperatures difference is
notably higher for CC MP, achieving %25 °C of temperature
difference for the highest DT F analyzed, while for PC, the
highest temperature difference is only %7 °C, for the lowest
DT F analyzed. Therefore, the DT F specification clearly
impacts more the counter-current MP operation. The default
value for this variable in the MP models is 3 °C, which gives
good average results for both contact types.
Figures 29 and 30 show, respectively, product molar flow
rates, product CO 2 , and methane molar compositions versus
the number of permeation elements selected for MPd-UOE
(with default DT F ¼ 3
C). The outcome is that the distributed MP model rapidly converges to constant values for
products results as the number of permeation elements
increases, with less than 1% of variation in all output variables for n_elements ! 5. The first conclusion is that the
short-cut method adopted in the MP models presents great
performance even for few permeation elements, or just one
—as in MPx-UOE—with low variations against the more
rigorous distributed simulations. For one permeation element
only, the average deviation was 0.7% for all analyzed
parameters (products molar flow rates, molar compositions,
and temperatures), with the highest oscillation value of 6.3%
for CO 2 content in the retentate (which in absolute values
represent only 0.01 on CO 2 molar fraction). On the other
hand, the consideration of constant component permeances
also contributes to this reduced variation between MPx-UOE
and MPd-UOE results. If the permeance values were corrected according to the temperature and CO 2 fugacity along
the membrane, the deviation of the lumped model results to
the distributed more rigorous model results would be more
expressive, since in the latter, the correction would be
applied to each membrane element. Another important
conclusion obtained with Figs. 29 and 30 is that the
approximation of log means by arithmetic means in
MPd-UOE algorithm (Sect. 3.1.3) for n_elements ! 10 was
smooth, since results converge to practically constant values
for n_elements ! 5, before the change of means
Fig. 28 Retentate and permeate temperatures in MPx-UOE versus DT F
specification for one single counter-current stage and one single parallel
stage
Fig. 29 Retentate and permeate molar flow rates in MPd-UOE versus
the number of permeation elements selected by user for one single
parallel stage
Membrane-Permeation Modeling for Carbon Capture …
173