

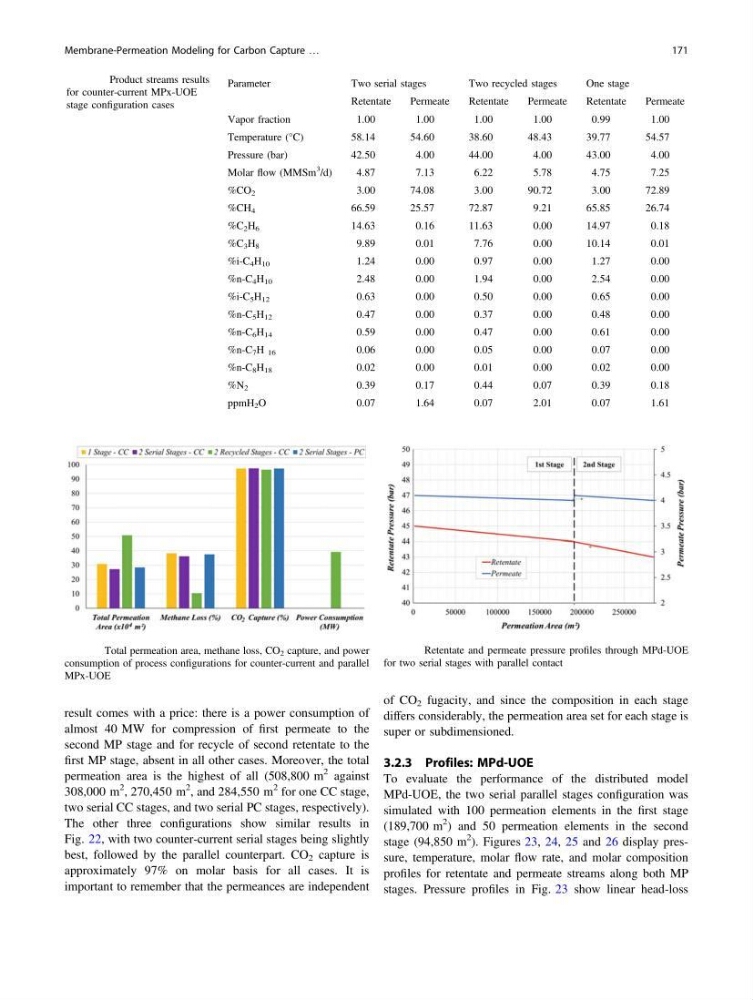
result comes with a price: there is a power consumption of
almost 40 MW for compression of first permeate to the
second MP stage and for recycle of second retentate to the
first MP stage, absent in all other cases. Moreover, the total
permeation area is the highest of all (508,800 m
2 against
308,000 m
2 , 270,450 m
2 , and 284,550 m
2 for one CC stage,
two serial CC stages, and two serial PC stages, respectively).
The other three configurations show similar results in
Fig. 22, with two counter-current serial stages being slightly
best, followed by the parallel counterpart. CO 2 capture is
approximately 97% on molar basis for all cases. It is
important to remember that the permeances are independent
of CO 2 fugacity, and since the composition in each stage
differs considerably, the permeation area set for each stage is
super or subdimensioned.
3.2.3 Profiles: MPd-UOE
To evaluate the performance of the distributed model
MPd-UOE, the two serial parallel stages configuration was
simulated with 100 permeation elements in the first stage
(189,700 m
2 ) and 50 permeation elements in the second
stage (94,850 m
2 ). Figures 23, 24, 25 and 26 display pressure, temperature, molar flow rate, and molar composition
profiles for retentate and permeate streams along both MP
stages. Pressure profiles in Fig. 23 show linear head-loss
Table 6 Product streams results
for counter-current MPx-UOE
stage configuration cases
Parameter
Two serial stages
Two recycled stages
One stage
Retentate
Permeate
Retentate
Permeate
Retentate
Permeate
Vapor fraction
1.00
1.00
1.00
1.00
0.99
1.00
Temperature (°C)
58.14
54.60
38.60
48.43
39.77
54.57
Pressure (bar)
42.50
4.00
44.00
4.00
43.00
4.00
Molar flow (MMSm
3
/d)
4.87
7.13
6.22
5.78
4.75
7.25
%CO 2
3.00
74.08
3.00
90.72
3.00
72.89
%CH 4
66.59
25.57
72.87
9.21
65.85
26.74
%C 2 H 6
14.63
0.16
11.63
0.00
14.97
0.18
%C 3 H 8
9.89
0.01
7.76
0.00
10.14
0.01
%i-C 4 H 10
1.24
0.00
0.97
0.00
1.27
0.00
%n-C 4 H 10
2.48
0.00
1.94
0.00
2.54
0.00
%i-C 5 H 12
0.63
0.00
0.50
0.00
0.65
0.00
%n-C 5 H 12
0.47
0.00
0.37
0.00
0.48
0.00
%n-C 6 H 14
0.59
0.00
0.47
0.00
0.61
0.00
%n-C 7 H 16
0.06
0.00
0.05
0.00
0.07
0.00
%n-C 8 H 18
0.02
0.00
0.01
0.00
0.02
0.00
%N 2
0.39
0.17
0.44
0.07
0.39
0.18
ppmH 2 O
0.07
1.64
0.07
2.01
0.07
1.61
Fig. 22 Total permeation area, methane loss, CO 2 capture, and power
consumption of process configurations for counter-current and parallel
MPx-UOE
Fig. 23 Retentate and permeate pressure profiles through MPd-UOE
for two serial stages with parallel contact
Membrane-Permeation Modeling for Carbon Capture …
171
almost 40 MW for compression of first permeate to the
second MP stage and for recycle of second retentate to the
first MP stage, absent in all other cases. Moreover, the total
permeation area is the highest of all (508,800 m
2 against
308,000 m
2 , 270,450 m
2 , and 284,550 m
2 for one CC stage,
two serial CC stages, and two serial PC stages, respectively).
The other three configurations show similar results in
Fig. 22, with two counter-current serial stages being slightly
best, followed by the parallel counterpart. CO 2 capture is
approximately 97% on molar basis for all cases. It is
important to remember that the permeances are independent
of CO 2 fugacity, and since the composition in each stage
differs considerably, the permeation area set for each stage is
super or subdimensioned.
3.2.3 Profiles: MPd-UOE
To evaluate the performance of the distributed model
MPd-UOE, the two serial parallel stages configuration was
simulated with 100 permeation elements in the first stage
(189,700 m
2 ) and 50 permeation elements in the second
stage (94,850 m
2 ). Figures 23, 24, 25 and 26 display pressure, temperature, molar flow rate, and molar composition
profiles for retentate and permeate streams along both MP
stages. Pressure profiles in Fig. 23 show linear head-loss
Table 6 Product streams results
for counter-current MPx-UOE
stage configuration cases
Parameter
Two serial stages
Two recycled stages
One stage
Retentate
Permeate
Retentate
Permeate
Retentate
Permeate
Vapor fraction
1.00
1.00
1.00
1.00
0.99
1.00
Temperature (°C)
58.14
54.60
38.60
48.43
39.77
54.57
Pressure (bar)
42.50
4.00
44.00
4.00
43.00
4.00
Molar flow (MMSm
3
/d)
4.87
7.13
6.22
5.78
4.75
7.25
%CO 2
3.00
74.08
3.00
90.72
3.00
72.89
%CH 4
66.59
25.57
72.87
9.21
65.85
26.74
%C 2 H 6
14.63
0.16
11.63
0.00
14.97
0.18
%C 3 H 8
9.89
0.01
7.76
0.00
10.14
0.01
%i-C 4 H 10
1.24
0.00
0.97
0.00
1.27
0.00
%n-C 4 H 10
2.48
0.00
1.94
0.00
2.54
0.00
%i-C 5 H 12
0.63
0.00
0.50
0.00
0.65
0.00
%n-C 5 H 12
0.47
0.00
0.37
0.00
0.48
0.00
%n-C 6 H 14
0.59
0.00
0.47
0.00
0.61
0.00
%n-C 7 H 16
0.06
0.00
0.05
0.00
0.07
0.00
%n-C 8 H 18
0.02
0.00
0.01
0.00
0.02
0.00
%N 2
0.39
0.17
0.44
0.07
0.39
0.18
ppmH 2 O
0.07
1.64
0.07
2.01
0.07
1.61
Fig. 22 Total permeation area, methane loss, CO 2 capture, and power
consumption of process configurations for counter-current and parallel
MPx-UOE
Fig. 23 Retentate and permeate pressure profiles through MPd-UOE
for two serial stages with parallel contact
Membrane-Permeation Modeling for Carbon Capture …
171