

(Ding et al. 2003), promoting the interaction between
cleaning agents and foulants.
MPR %
ð Þfor water rinsing
¼ 46:23 þ 8:55 Â shear stress þ 6:05 Â temperature
þ 4:32  time À 0:14  shear stress  time
þ 2:45  temperature  time
À 3:05 Â shear stress
2
À 6:09 Â temperature
2
À 1:23 Â time
2
ð6Þ
MPR %
ð Þ for chemical cleaning
¼ 92:51 þ 11:55 Â shear stress
þ 21:36 Â temperature þ 0:67 Â time
À 3:91 Â concentration
À 2:2  shear stress  time
þ 0:33  temperature  time
À 3:08  time  concentration
À 4:21 Â shear stress
2
À 3:7 Â temperature
2
À 6:96 Â time
2
À concentration
2
ð7Þ
In order to investigate the influence of operational conditions, including shear stress, temperature, TMP, cleaning
time, and cleaning agent concentration, as well optimize the
membrane cleaning process, the response surface methodology was utilized for this process optimization. The mathematical model for explaining operation condition of
cleaning process and MPRs is acquired and shown in
Fig. 6 Pictures of cheese: a FD-DVS YF-L903 and b Yogurt
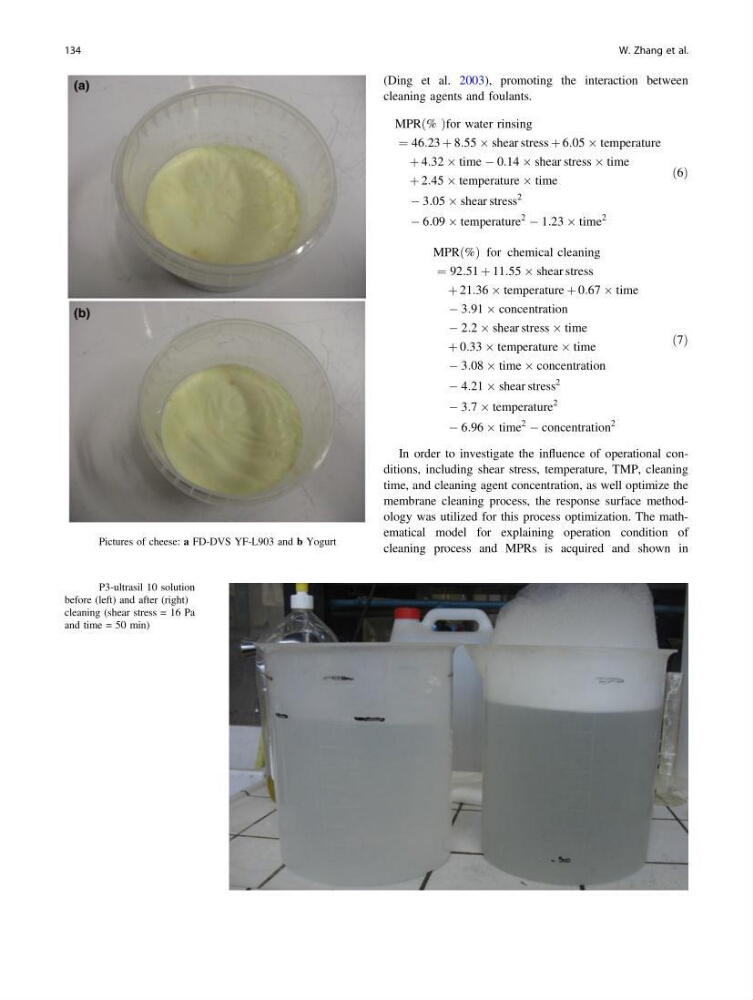
Fig. 7 P3-ultrasil 10 solution
before (left) and after (right)
cleaning (shear stress = 16 Pa
and time = 50 min)
134
W. Zhang et al.
cleaning agents and foulants.
MPR %
ð Þfor water rinsing
¼ 46:23 þ 8:55 Â shear stress þ 6:05 Â temperature
þ 4:32  time À 0:14  shear stress  time
þ 2:45  temperature  time
À 3:05 Â shear stress
2
À 6:09 Â temperature
2
À 1:23 Â time
2
ð6Þ
MPR %
ð Þ for chemical cleaning
¼ 92:51 þ 11:55 Â shear stress
þ 21:36 Â temperature þ 0:67 Â time
À 3:91 Â concentration
À 2:2  shear stress  time
þ 0:33  temperature  time
À 3:08  time  concentration
À 4:21 Â shear stress
2
À 3:7 Â temperature
2
À 6:96 Â time
2
À concentration
2
ð7Þ
In order to investigate the influence of operational conditions, including shear stress, temperature, TMP, cleaning
time, and cleaning agent concentration, as well optimize the
membrane cleaning process, the response surface methodology was utilized for this process optimization. The mathematical model for explaining operation condition of
cleaning process and MPRs is acquired and shown in
Fig. 6 Pictures of cheese: a FD-DVS YF-L903 and b Yogurt
Fig. 7 P3-ultrasil 10 solution
before (left) and after (right)
cleaning (shear stress = 16 Pa
and time = 50 min)
134
W. Zhang et al.