

Availability of specific system data is reported
as a barrier in a number of different fields for the
prediction of heatwave impacts: rail [57], energy
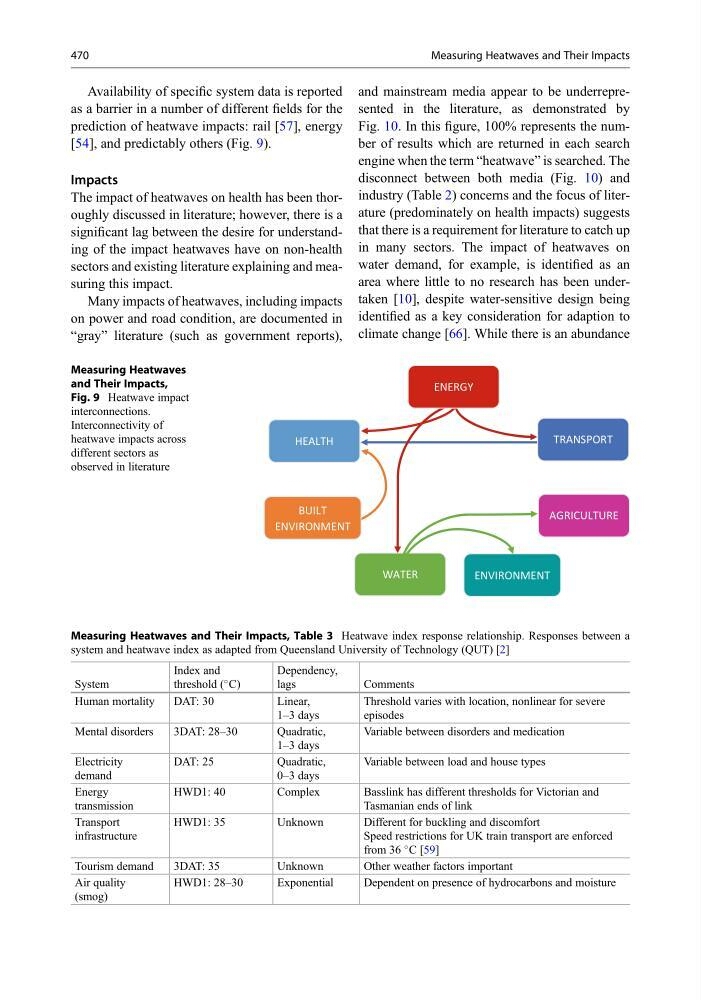
[54], and predictably others (Fig. 9).
Impacts
The impact of heatwaves on health has been thoroughly discussed in literature; however, there is a
significant lag between the desire for understanding of the impact heatwaves have on non-health
sectors and existing literature explaining and measuring this impact.
Many impacts of heatwaves, including impacts
on power and road condition, are documented in
“gray” literature (such as government reports),
and mainstream media appear to be underrepresented in the literature, as demonstrated by
Fig. 10. In this figure, 100% represents the number of results which are returned in each search
engine when the term “heatwave” is searched. The
disconnect between both media (Fig. 10) and
industry (Table 2) concerns and the focus of literature (predominately on health impacts) suggests
that there is a requirement for literature to catch up
in many sectors. The impact of heatwaves on
water demand, for example, is identified as an
area where little to no research has been undertaken [10], despite water-sensitive design being
identified as a key consideration for adaption to
climate change [66]. While there is an abundance
HEALTH
ENERGY
TRANSPORT
AGRICULTURE
WATER
BUILT
ENVIRONMENT
ENVIRONMENT
Measuring Heatwaves
and Their Impacts,
Fig. 9 Heatwave impact
interconnections.
Interconnectivity of
heatwave impacts across
different sectors as
observed in literature
Measuring Heatwaves and Their Impacts, Table 3 Heatwave index response relationship. Responses between a
system and heatwave index as adapted from Queensland University of Technology (QUT) [2]
System
Index and
threshold (
C)
Dependency,
lags
Comments
Human mortality
DAT: 30
Linear,
1–3 days
Threshold varies with location, nonlinear for severe
episodes
Mental disorders
3DAT: 28–30
Quadratic,
1–3 days
Variable between disorders and medication
Electricity
demand
DAT: 25
Quadratic,
0–3 days
Variable between load and house types
Energy
transmission
HWD1: 40
Complex
Basslink has different thresholds for Victorian and
Tasmanian ends of link
Transport
infrastructure
HWD1: 35
Unknown
Different for buckling and discomfort
Speed restrictions for UK train transport are enforced
from 36
C [59]
Tourism demand
3DAT: 35
Unknown
Other weather factors important
Air quality
(smog)
HWD1: 28–30
Exponential
Dependent on presence of hydrocarbons and moisture
470
Measuring Heatwaves and Their Impacts
as a barrier in a number of different fields for the
prediction of heatwave impacts: rail [57], energy
[54], and predictably others (Fig. 9).
Impacts
The impact of heatwaves on health has been thoroughly discussed in literature; however, there is a
significant lag between the desire for understanding of the impact heatwaves have on non-health
sectors and existing literature explaining and measuring this impact.
Many impacts of heatwaves, including impacts
on power and road condition, are documented in
“gray” literature (such as government reports),
and mainstream media appear to be underrepresented in the literature, as demonstrated by
Fig. 10. In this figure, 100% represents the number of results which are returned in each search
engine when the term “heatwave” is searched. The
disconnect between both media (Fig. 10) and
industry (Table 2) concerns and the focus of literature (predominately on health impacts) suggests
that there is a requirement for literature to catch up
in many sectors. The impact of heatwaves on
water demand, for example, is identified as an
area where little to no research has been undertaken [10], despite water-sensitive design being
identified as a key consideration for adaption to
climate change [66]. While there is an abundance
HEALTH
ENERGY
TRANSPORT
AGRICULTURE
WATER
BUILT
ENVIRONMENT
ENVIRONMENT
Measuring Heatwaves
and Their Impacts,
Fig. 9 Heatwave impact
interconnections.
Interconnectivity of
heatwave impacts across
different sectors as
observed in literature
Measuring Heatwaves and Their Impacts, Table 3 Heatwave index response relationship. Responses between a
system and heatwave index as adapted from Queensland University of Technology (QUT) [2]
System
Index and
threshold (
C)
Dependency,
lags
Comments
Human mortality
DAT: 30
Linear,
1–3 days
Threshold varies with location, nonlinear for severe
episodes
Mental disorders
3DAT: 28–30
Quadratic,
1–3 days
Variable between disorders and medication
Electricity
demand
DAT: 25
Quadratic,
0–3 days
Variable between load and house types
Energy
transmission
HWD1: 40
Complex
Basslink has different thresholds for Victorian and
Tasmanian ends of link
Transport
infrastructure
HWD1: 35
Unknown
Different for buckling and discomfort
Speed restrictions for UK train transport are enforced
from 36
C [59]
Tourism demand
3DAT: 35
Unknown
Other weather factors important
Air quality
(smog)
HWD1: 28–30
Exponential
Dependent on presence of hydrocarbons and moisture
470
Measuring Heatwaves and Their Impacts