

For the apparent temperature index, several
accepted critical thresholds are defined (Granger
and Berechree, cited in [65]):
• T a = 32 degrees Celsius and above: Cramps or
exhaustion
• T a = 41 degrees Celsius and above: Heat stroke
• T a = 54 degrees Celsius and above: Heat stroke
or brain hemorrhage very likely
The creation of the relationship between the
index value and the system response (impact)
allows for the creation of the vulnerability curves
which are then able to be used as an input into the
conceptual framework of risk assessment, as
described in the introduction.
Non-health Domains
Currently, there is no proper framework to measure the impacts of heatwaves on most non-health
domains using heatwave indices. Within Table 3,
there are temperature thresholds for certain nonhealth domains. Electricity demand, energy transmission, and transport infrastructure have all been
given threshold limits. Very little literature has
been found which applies indices to the study of
heatwave impacts.
Analysis
Apparent in literature but not explicitly
highlighted is the interdependencies between
different sectors – for example, heatwaves causing blackouts (affecting the electricity sector)
can lead to air conditioning failures, leading to
higher mortality and morbidity (within the health
sector). The impact diagrams throughout this
literature review highlight the range of interdependencies between different systems, which
existing heatwave indices do not consider. Incorporating this into the proposed framework is an
objective of the proposed research, and using
this in practice would be a breakthrough in the
modeling and understanding of heatwaves – this
however will prove challenging. While Fig. 2
shows that the health sector is most impacted
by other sectors, this is likely a result of the
health sector being the predominant focus of
existing heatwave research and not necessarily
an accurate depiction of the interdependencies
between sectors.
Figure 9 reiterates the interdependencies
between heatwave impacts on different sectors
as highlighted by the previous impact diagrams,
on a more macroscopic scale. For example,
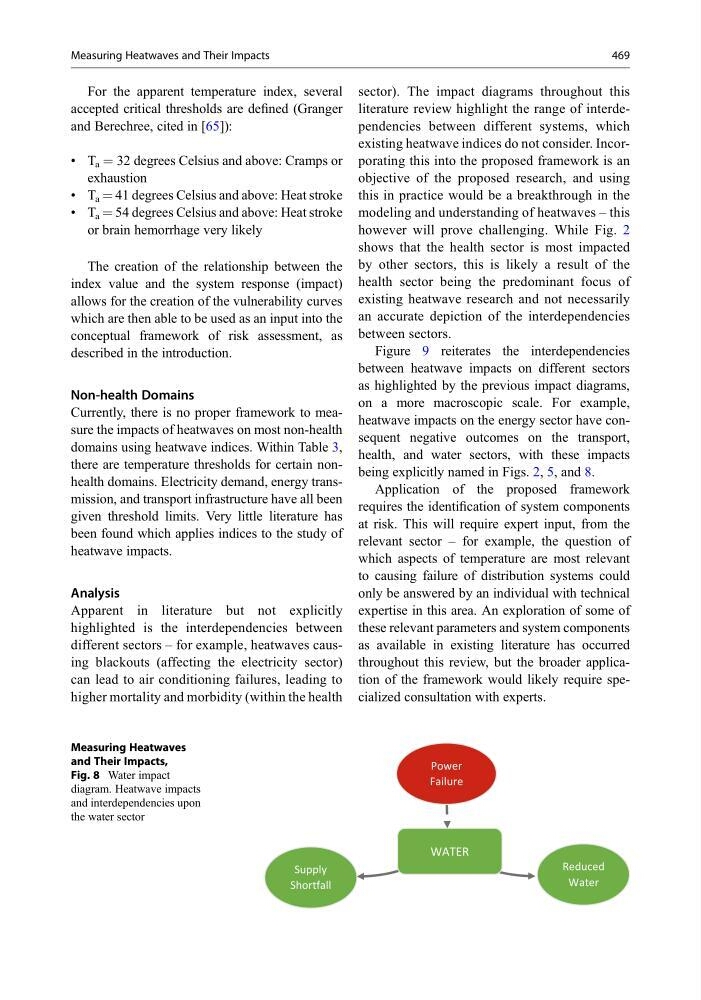
heatwave impacts on the energy sector have consequent negative outcomes on the transport,
health, and water sectors, with these impacts
being explicitly named in Figs. 2, 5, and 8.
Application of the proposed framework
requires the identification of system components
at risk. This will require expert input, from the
relevant sector – for example, the question of
which aspects of temperature are most relevant
to causing failure of distribution systems could
only be answered by an individual with technical
expertise in this area. An exploration of some of
these relevant parameters and system components
as available in existing literature has occurred
throughout this review, but the broader application of the framework would likely require specialized consultation with experts.
WATER
Supply
Shortfall
Reduced
Water
Power
Failure
Measuring Heatwaves
and Their Impacts,
Fig. 8 Water impact
diagram. Heatwave impacts
and interdependencies upon
the water sector
Measuring Heatwaves and Their Impacts
469
accepted critical thresholds are defined (Granger
and Berechree, cited in [65]):
• T a = 32 degrees Celsius and above: Cramps or
exhaustion
• T a = 41 degrees Celsius and above: Heat stroke
• T a = 54 degrees Celsius and above: Heat stroke
or brain hemorrhage very likely
The creation of the relationship between the
index value and the system response (impact)
allows for the creation of the vulnerability curves
which are then able to be used as an input into the
conceptual framework of risk assessment, as
described in the introduction.
Non-health Domains
Currently, there is no proper framework to measure the impacts of heatwaves on most non-health
domains using heatwave indices. Within Table 3,
there are temperature thresholds for certain nonhealth domains. Electricity demand, energy transmission, and transport infrastructure have all been
given threshold limits. Very little literature has
been found which applies indices to the study of
heatwave impacts.
Analysis
Apparent in literature but not explicitly
highlighted is the interdependencies between
different sectors – for example, heatwaves causing blackouts (affecting the electricity sector)
can lead to air conditioning failures, leading to
higher mortality and morbidity (within the health
sector). The impact diagrams throughout this
literature review highlight the range of interdependencies between different systems, which
existing heatwave indices do not consider. Incorporating this into the proposed framework is an
objective of the proposed research, and using
this in practice would be a breakthrough in the
modeling and understanding of heatwaves – this
however will prove challenging. While Fig. 2
shows that the health sector is most impacted
by other sectors, this is likely a result of the
health sector being the predominant focus of
existing heatwave research and not necessarily
an accurate depiction of the interdependencies
between sectors.
Figure 9 reiterates the interdependencies
between heatwave impacts on different sectors
as highlighted by the previous impact diagrams,
on a more macroscopic scale. For example,
heatwave impacts on the energy sector have consequent negative outcomes on the transport,
health, and water sectors, with these impacts
being explicitly named in Figs. 2, 5, and 8.
Application of the proposed framework
requires the identification of system components
at risk. This will require expert input, from the
relevant sector – for example, the question of
which aspects of temperature are most relevant
to causing failure of distribution systems could
only be answered by an individual with technical
expertise in this area. An exploration of some of
these relevant parameters and system components
as available in existing literature has occurred
throughout this review, but the broader application of the framework would likely require specialized consultation with experts.
WATER
Supply
Shortfall
Reduced
Water
Power
Failure
Measuring Heatwaves
and Their Impacts,
Fig. 8 Water impact
diagram. Heatwave impacts
and interdependencies upon
the water sector
Measuring Heatwaves and Their Impacts
469