

during a critical phase of embryonic development.” The effect of heatwaves is often just a
further stress on an ecosystem, and the magnitude
of the damage from a heatwave is related to how
much stress a system is already under [60].
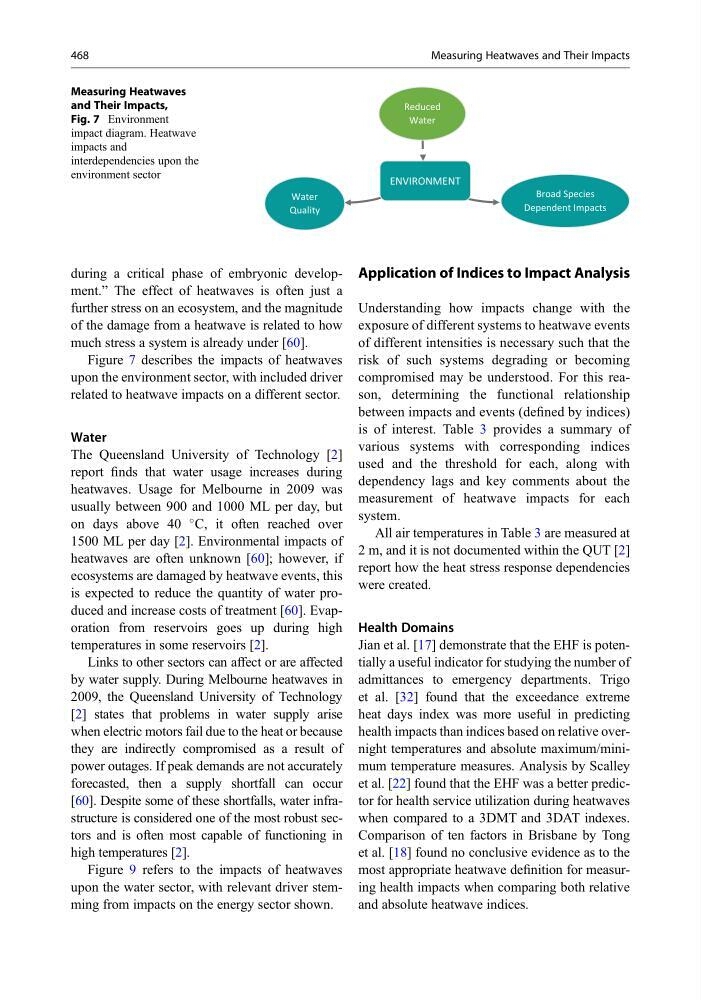
Figure 7 describes the impacts of heatwaves
upon the environment sector, with included driver
related to heatwave impacts on a different sector.
Water
The Queensland University of Technology [2]
report finds that water usage increases during
heatwaves. Usage for Melbourne in 2009 was
usually between 900 and 1000 ML per day, but
on days above 40
C, it often reached over
1500 ML per day [2]. Environmental impacts of
heatwaves are often unknown [60]; however, if
ecosystems are damaged by heatwave events, this
is expected to reduce the quantity of water produced and increase costs of treatment [60]. Evaporation from reservoirs goes up during high
temperatures in some reservoirs [2].
Links to other sectors can affect or are affected
by water supply. During Melbourne heatwaves in
2009, the Queensland University of Technology
[2] states that problems in water supply arise
when electric motors fail due to the heat or because
they are indirectly compromised as a result of
power outages. If peak demands are not accurately
forecasted, then a supply shortfall can occur
[60]. Despite some of these shortfalls, water infrastructure is considered one of the most robust sectors and is often most capable of functioning in
high temperatures [2].
Figure 9 refers to the impacts of heatwaves
upon the water sector, with relevant driver stemming from impacts on the energy sector shown.
Application of Indices to Impact Analysis
Understanding how impacts change with the
exposure of different systems to heatwave events
of different intensities is necessary such that the
risk of such systems degrading or becoming
compromised may be understood. For this reason, determining the functional relationship
between impacts and events (defined by indices)
is of interest. Table 3 provides a summary of
various systems with corresponding indices
used and the threshold for each, along with
dependency lags and key comments about the
measurement of heatwave impacts for each
system.
All air temperatures in Table 3 are measured at
2 m, and it is not documented within the QUT [2]
report how the heat stress response dependencies
were created.
Health Domains
Jian et al. [17] demonstrate that the EHF is potentially a useful indicator for studying the number of
admittances to emergency departments. Trigo
et al. [32] found that the exceedance extreme
heat days index was more useful in predicting
health impacts than indices based on relative overnight temperatures and absolute maximum/minimum temperature measures. Analysis by Scalley
et al. [22] found that the EHF was a better predictor for health service utilization during heatwaves
when compared to a 3DMT and 3DAT indexes.
Comparison of ten factors in Brisbane by Tong
et al. [18] found no conclusive evidence as to the
most appropriate heatwave definition for measuring health impacts when comparing both relative
and absolute heatwave indices.
ENVIRONMENT
Water
Quality
Broad Species
Dependent Impacts
Reduced
Water
Measuring Heatwaves
and Their Impacts,
Fig. 7 Environment
impact diagram. Heatwave
impacts and
interdependencies upon the
environment sector
468
Measuring Heatwaves and Their Impacts
further stress on an ecosystem, and the magnitude
of the damage from a heatwave is related to how
much stress a system is already under [60].
Figure 7 describes the impacts of heatwaves
upon the environment sector, with included driver
related to heatwave impacts on a different sector.
Water
The Queensland University of Technology [2]
report finds that water usage increases during
heatwaves. Usage for Melbourne in 2009 was
usually between 900 and 1000 ML per day, but
on days above 40
C, it often reached over
1500 ML per day [2]. Environmental impacts of
heatwaves are often unknown [60]; however, if
ecosystems are damaged by heatwave events, this
is expected to reduce the quantity of water produced and increase costs of treatment [60]. Evaporation from reservoirs goes up during high
temperatures in some reservoirs [2].
Links to other sectors can affect or are affected
by water supply. During Melbourne heatwaves in
2009, the Queensland University of Technology
[2] states that problems in water supply arise
when electric motors fail due to the heat or because
they are indirectly compromised as a result of
power outages. If peak demands are not accurately
forecasted, then a supply shortfall can occur
[60]. Despite some of these shortfalls, water infrastructure is considered one of the most robust sectors and is often most capable of functioning in
high temperatures [2].
Figure 9 refers to the impacts of heatwaves
upon the water sector, with relevant driver stemming from impacts on the energy sector shown.
Application of Indices to Impact Analysis
Understanding how impacts change with the
exposure of different systems to heatwave events
of different intensities is necessary such that the
risk of such systems degrading or becoming
compromised may be understood. For this reason, determining the functional relationship
between impacts and events (defined by indices)
is of interest. Table 3 provides a summary of
various systems with corresponding indices
used and the threshold for each, along with
dependency lags and key comments about the
measurement of heatwave impacts for each
system.
All air temperatures in Table 3 are measured at
2 m, and it is not documented within the QUT [2]
report how the heat stress response dependencies
were created.
Health Domains
Jian et al. [17] demonstrate that the EHF is potentially a useful indicator for studying the number of
admittances to emergency departments. Trigo
et al. [32] found that the exceedance extreme
heat days index was more useful in predicting
health impacts than indices based on relative overnight temperatures and absolute maximum/minimum temperature measures. Analysis by Scalley
et al. [22] found that the EHF was a better predictor for health service utilization during heatwaves
when compared to a 3DMT and 3DAT indexes.
Comparison of ten factors in Brisbane by Tong
et al. [18] found no conclusive evidence as to the
most appropriate heatwave definition for measuring health impacts when comparing both relative
and absolute heatwave indices.
ENVIRONMENT
Water
Quality
Broad Species
Dependent Impacts
Reduced
Water
Measuring Heatwaves
and Their Impacts,
Fig. 7 Environment
impact diagram. Heatwave
impacts and
interdependencies upon the
environment sector
468
Measuring Heatwaves and Their Impacts