

halocarbon ODS is believed to be fairly well
constrained, there are many other uncertainties.
The future atmospheric concentrations of the
major GHGs CO 2 , CH 4 , and N 2 O are uncertain,
especially beyond the middle of this century. N 2 O
itself is the source of stratospheric odd nitrogen,
which can cause ozone loss (Table 1).
Ravishankara et al. [21] argued that in the future,
as halocarbons are now declining, N 2 O will be the
major anthropogenic ODS. To research these
issues of chemistry–climate interactions, and to
quantify these impacts, will require the development of detailed Chemistry–Climate Models
(CCMs). CCMs are essentially versions of climate
models with detailed interactive chemistry. In the
future, these models will become part of larger
3.0
Tropical upper stratosphere
2.0
1.0
0.0
Ozone [ppm]
–1.0
–2.0
3.0
2.0
1.0
0.0
–1.0
–2.0
100%
75%
50%
25%
1960 1980 2000 2020 2040 2060 2080
ESC [ppb]
2100
0.60
Tropical lower stratosphere
0.30
0.00
–0.30
Ozone [ppm]
–0.60
–0.90
1.0
0.5
0.0
–1.0
–0.5
–1.5
100%
75%
50%
25%
1960 1980 2000 2020 2040 2060 2080
ESC [ppb]
2100
2.0
NH midlatitudes upper stratosphere
1.0
0.0
Ozone [ppm]
–1.0
–2.0
4.0
2.0
0.0
–2.0
–4.0
100%
75%
50%
25%
1960 1980 2000 2020 2040 2060 2080
ESC [ppb]
2100
0.40
0.20
0.00
–0.20
Ozone [ppm]
–0.40
2.0
1.0
0.0
–1.0
–2.0
100%
75%
50%
25%
1960 1980 2000 2020 2040 2060 2080
ESC [ppb]
2100
2.0
SH midlatitudes upper stratosphere
1.0
0.0
Ozone [ppm]
–1.0
–2.0
4.0
2.0
0.0
–2.0
–4.0
100%
75%
50%
25%
1960 1980 2000 2020 2040 2060 2080
ESC [ppb]
2100
0.60
SH midlatitudes lower stratosphere
NH midlatitudes lower stratosphere
0.30
0.00
–0.30
Ozone [ppm]
–0.60
2.0
1.0
0.0
–1.0
–2.0
100%
75%
50%
25%
1960
f
e
d
c
b
a
1980 2000 2020 2040 2060 2080
ESC [ppb]
2100
MMT 03 REF-B2(fODS)
MMT 03 REF-B2(fGHG)
MMT ESC REF-B2(fODS)
MMT O3(fGHG)
MMT 03 fODS
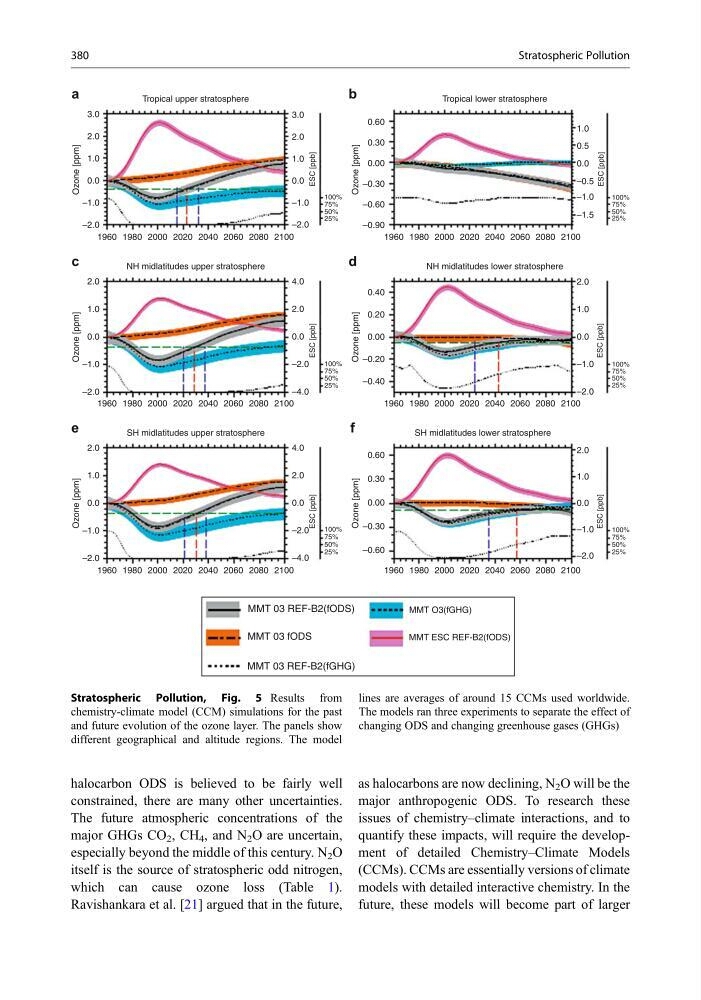
Stratospheric Pollution, Fig. 5 Results from
chemistry-climate model (CCM) simulations for the past
and future evolution of the ozone layer. The panels show
different geographical and altitude regions. The model
lines are averages of around 15 CCMs used worldwide.
The models ran three experiments to separate the effect of
changing ODS and changing greenhouse gases (GHGs)
380
Stratospheric Pollution
constrained, there are many other uncertainties.
The future atmospheric concentrations of the
major GHGs CO 2 , CH 4 , and N 2 O are uncertain,
especially beyond the middle of this century. N 2 O
itself is the source of stratospheric odd nitrogen,
which can cause ozone loss (Table 1).
Ravishankara et al. [21] argued that in the future,
as halocarbons are now declining, N 2 O will be the
major anthropogenic ODS. To research these
issues of chemistry–climate interactions, and to
quantify these impacts, will require the development of detailed Chemistry–Climate Models
(CCMs). CCMs are essentially versions of climate
models with detailed interactive chemistry. In the
future, these models will become part of larger
3.0
Tropical upper stratosphere
2.0
1.0
0.0
Ozone [ppm]
–1.0
–2.0
3.0
2.0
1.0
0.0
–1.0
–2.0
100%
75%
50%
25%
1960 1980 2000 2020 2040 2060 2080
ESC [ppb]
2100
0.60
Tropical lower stratosphere
0.30
0.00
–0.30
Ozone [ppm]
–0.60
–0.90
1.0
0.5
0.0
–1.0
–0.5
–1.5
100%
75%
50%
25%
1960 1980 2000 2020 2040 2060 2080
ESC [ppb]
2100
2.0
NH midlatitudes upper stratosphere
1.0
0.0
Ozone [ppm]
–1.0
–2.0
4.0
2.0
0.0
–2.0
–4.0
100%
75%
50%
25%
1960 1980 2000 2020 2040 2060 2080
ESC [ppb]
2100
0.40
0.20
0.00
–0.20
Ozone [ppm]
–0.40
2.0
1.0
0.0
–1.0
–2.0
100%
75%
50%
25%
1960 1980 2000 2020 2040 2060 2080
ESC [ppb]
2100
2.0
SH midlatitudes upper stratosphere
1.0
0.0
Ozone [ppm]
–1.0
–2.0
4.0
2.0
0.0
–2.0
–4.0
100%
75%
50%
25%
1960 1980 2000 2020 2040 2060 2080
ESC [ppb]
2100
0.60
SH midlatitudes lower stratosphere
NH midlatitudes lower stratosphere
0.30
0.00
–0.30
Ozone [ppm]
–0.60
2.0
1.0
0.0
–1.0
–2.0
100%
75%
50%
25%
1960
f
e
d
c
b
a
1980 2000 2020 2040 2060 2080
ESC [ppb]
2100
MMT 03 REF-B2(fODS)
MMT 03 REF-B2(fGHG)
MMT ESC REF-B2(fODS)
MMT O3(fGHG)
MMT 03 fODS
Stratospheric Pollution, Fig. 5 Results from
chemistry-climate model (CCM) simulations for the past
and future evolution of the ozone layer. The panels show
different geographical and altitude regions. The model
lines are averages of around 15 CCMs used worldwide.
The models ran three experiments to separate the effect of
changing ODS and changing greenhouse gases (GHGs)
380
Stratospheric Pollution