

winters ozone loss of about 50% at 20 km,
corresponding to about 30% of the column is
observed.
Middle Latitudes and Tropics
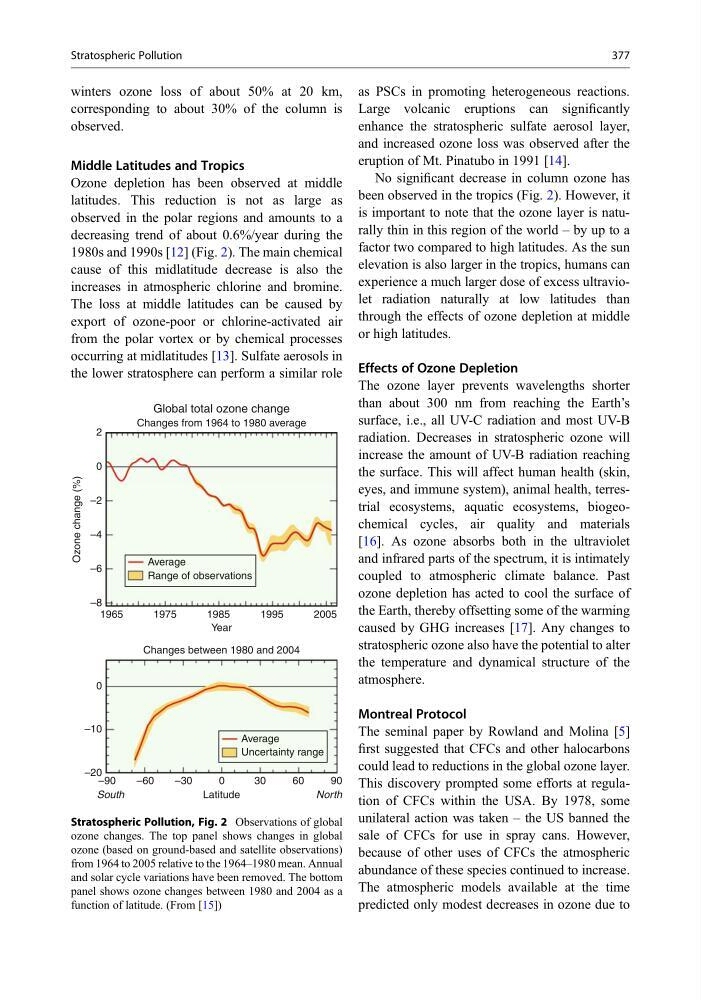
Ozone depletion has been observed at middle
latitudes. This reduction is not as large as
observed in the polar regions and amounts to a
decreasing trend of about 0.6%/year during the
1980s and 1990s [12] (Fig. 2). The main chemical
cause of this midlatitude decrease is also the
increases in atmospheric chlorine and bromine.
The loss at middle latitudes can be caused by
export of ozone-poor or chlorine-activated air
from the polar vortex or by chemical processes
occurring at midlatitudes [13]. Sulfate aerosols in
the lower stratosphere can perform a similar role
as PSCs in promoting heterogeneous reactions.
Large volcanic eruptions can significantly
enhance the stratospheric sulfate aerosol layer,
and increased ozone loss was observed after the
eruption of Mt. Pinatubo in 1991 [14].
No significant decrease in column ozone has
been observed in the tropics (Fig. 2). However, it
is important to note that the ozone layer is naturally thin in this region of the world – by up to a
factor two compared to high latitudes. As the sun
elevation is also larger in the tropics, humans can
experience a much larger dose of excess ultraviolet radiation naturally at low latitudes than
through the effects of ozone depletion at middle
or high latitudes.
Effects of Ozone Depletion
The ozone layer prevents wavelengths shorter
than about 300 nm from reaching the Earth’s
surface, i.e., all UV-C radiation and most UV-B
radiation. Decreases in stratospheric ozone will
increase the amount of UV-B radiation reaching
the surface. This will affect human health (skin,
eyes, and immune system), animal health, terrestrial ecosystems, aquatic ecosystems, biogeochemical cycles, air quality and materials
[16]. As ozone absorbs both in the ultraviolet
and infrared parts of the spectrum, it is intimately
coupled to atmospheric climate balance. Past
ozone depletion has acted to cool the surface of
the Earth, thereby offsetting some of the warming
caused by GHG increases [17]. Any changes to
stratospheric ozone also have the potential to alter
the temperature and dynamical structure of the
atmosphere.
Montreal Protocol
The seminal paper by Rowland and Molina [5]
first suggested that CFCs and other halocarbons
could lead to reductions in the global ozone layer.
This discovery prompted some efforts at regulation of CFCs within the USA. By 1978, some
unilateral action was taken – the US banned the
sale of CFCs for use in spray cans. However,
because of other uses of CFCs the atmospheric
abundance of these species continued to increase.
The atmospheric models available at the time
predicted only modest decreases in ozone due to
2
0
–2
–4
–6
–8
0
–10
–20
1965
–90
–60
–30
0
Latitude
North
South
30
60
90
1975
1985
Year
Average
Ozone change (%)
Range of observations
Global total ozone change
Changes from 1964 to 1980 average
Average
Uncertainty range
Changes between 1980 and 2004
1995
2005
Stratospheric Pollution, Fig. 2 Observations of global
ozone changes. The top panel shows changes in global
ozone (based on ground-based and satellite observations)
from 1964 to 2005 relative to the 1964–1980 mean. Annual
and solar cycle variations have been removed. The bottom
panel shows ozone changes between 1980 and 2004 as a
function of latitude. (From [15])
Stratospheric Pollution
377
corresponding to about 30% of the column is
observed.
Middle Latitudes and Tropics
Ozone depletion has been observed at middle
latitudes. This reduction is not as large as
observed in the polar regions and amounts to a
decreasing trend of about 0.6%/year during the
1980s and 1990s [12] (Fig. 2). The main chemical
cause of this midlatitude decrease is also the
increases in atmospheric chlorine and bromine.
The loss at middle latitudes can be caused by
export of ozone-poor or chlorine-activated air
from the polar vortex or by chemical processes
occurring at midlatitudes [13]. Sulfate aerosols in
the lower stratosphere can perform a similar role
as PSCs in promoting heterogeneous reactions.
Large volcanic eruptions can significantly
enhance the stratospheric sulfate aerosol layer,
and increased ozone loss was observed after the
eruption of Mt. Pinatubo in 1991 [14].
No significant decrease in column ozone has
been observed in the tropics (Fig. 2). However, it
is important to note that the ozone layer is naturally thin in this region of the world – by up to a
factor two compared to high latitudes. As the sun
elevation is also larger in the tropics, humans can
experience a much larger dose of excess ultraviolet radiation naturally at low latitudes than
through the effects of ozone depletion at middle
or high latitudes.
Effects of Ozone Depletion
The ozone layer prevents wavelengths shorter
than about 300 nm from reaching the Earth’s
surface, i.e., all UV-C radiation and most UV-B
radiation. Decreases in stratospheric ozone will
increase the amount of UV-B radiation reaching
the surface. This will affect human health (skin,
eyes, and immune system), animal health, terrestrial ecosystems, aquatic ecosystems, biogeochemical cycles, air quality and materials
[16]. As ozone absorbs both in the ultraviolet
and infrared parts of the spectrum, it is intimately
coupled to atmospheric climate balance. Past
ozone depletion has acted to cool the surface of
the Earth, thereby offsetting some of the warming
caused by GHG increases [17]. Any changes to
stratospheric ozone also have the potential to alter
the temperature and dynamical structure of the
atmosphere.
Montreal Protocol
The seminal paper by Rowland and Molina [5]
first suggested that CFCs and other halocarbons
could lead to reductions in the global ozone layer.
This discovery prompted some efforts at regulation of CFCs within the USA. By 1978, some
unilateral action was taken – the US banned the
sale of CFCs for use in spray cans. However,
because of other uses of CFCs the atmospheric
abundance of these species continued to increase.
The atmospheric models available at the time
predicted only modest decreases in ozone due to
2
0
–2
–4
–6
–8
0
–10
–20
1965
–90
–60
–30
0
Latitude
North
South
30
60
90
1975
1985
Year
Average
Ozone change (%)
Range of observations
Global total ozone change
Changes from 1964 to 1980 average
Average
Uncertainty range
Changes between 1980 and 2004
1995
2005
Stratospheric Pollution, Fig. 2 Observations of global
ozone changes. The top panel shows changes in global
ozone (based on ground-based and satellite observations)
from 1964 to 2005 relative to the 1964–1980 mean. Annual
and solar cycle variations have been removed. The bottom
panel shows ozone changes between 1980 and 2004 as a
function of latitude. (From [15])
Stratospheric Pollution
377