

policies in the coming years. Much of the current
focus is on trade-offs between different scenarios.
While there are win-win situations where policy
will improve both air quality and reduce greenhouse gas emissions, many measures may not
result in such co-benefits. As stated in the IPCC
Fourth Assessment Report “Future climate
change may cause significant air quality degradation by changing the dispersion rate of pollutants,
the chemical environment for ozone and aerosol
generation and the strength of emissions from the
biosphere, fires, and dust. The sign and magnitude
of these effects are highly uncertain and will vary
regionally” [74]. Ozone and aerosols are the two
air pollutants of greatest concern for public health
[75], while being key players in climate change
and feedbacks [36, 76].
Air pollution and greenhouse gases often have
common sources of emission. In addition to the
common sources, there are some gases which are
both air pollutants and act as greenhouse gases,
such as ozone [77]. To best address both issues, a
significant effort will need to be made to understand the impact of a changing climate on air
quality and vice versa. Current work with global
and regional models that couple chemical transport and general circulation simulations have
found that climate change alone could increase
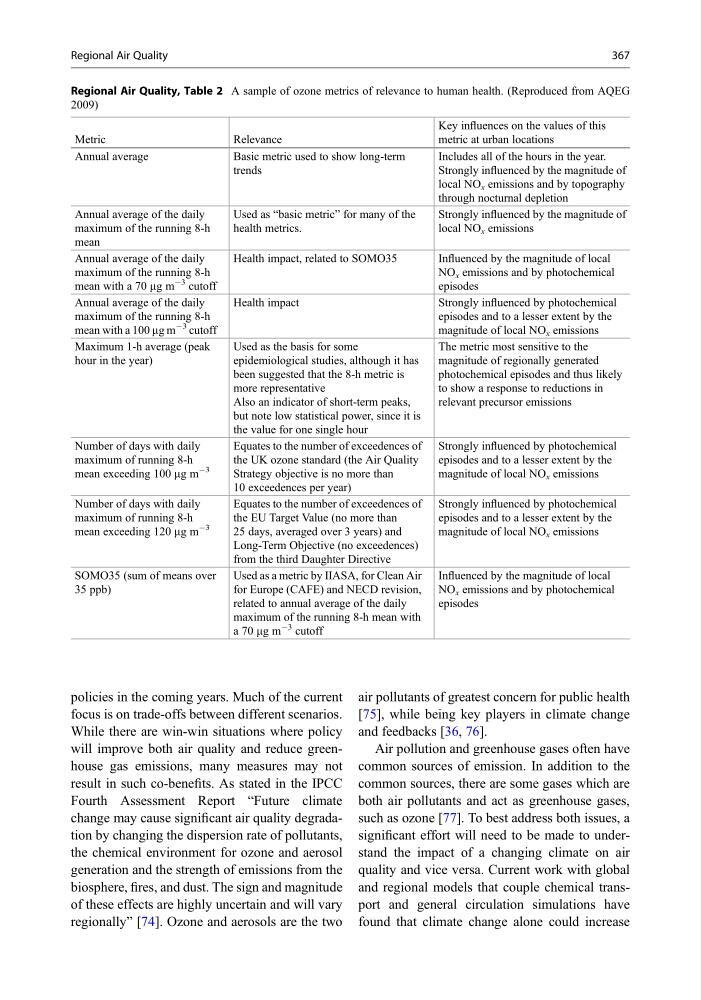
Regional Air Quality, Table 2 A sample of ozone metrics of relevance to human health. (Reproduced from AQEG
2009)
Metric
Relevance
Key influences on the values of this
metric at urban locations
Annual average
Basic metric used to show long-term
trends
Includes all of the hours in the year.
Strongly influenced by the magnitude of
local NO x emissions and by topography
through nocturnal depletion
Annual average of the daily
maximum of the running 8-h
mean
Used as “basic metric” for many of the
health metrics.
Strongly influenced by the magnitude of
local NO x emissions
Annual average of the daily
maximum of the running 8-h
mean with a 70 mg m
À3 cutoff
Health impact, related to SOMO35
Influenced by the magnitude of local
NO x emissions and by photochemical
episodes
Annual average of the daily
maximum of the running 8-h
mean with a 100 mg m
À3 cutoff
Health impact
Strongly influenced by photochemical
episodes and to a lesser extent by the
magnitude of local NO x emissions
Maximum 1-h average (peak
hour in the year)
Used as the basis for some
epidemiological studies, although it has
been suggested that the 8-h metric is
more representative
Also an indicator of short-term peaks,
but note low statistical power, since it is
the value for one single hour
The metric most sensitive to the
magnitude of regionally generated
photochemical episodes and thus likely
to show a response to reductions in
relevant precursor emissions
Number of days with daily
maximum of running 8-h
mean exceeding 100 mg m
À3
Equates to the number of exceedences of
the UK ozone standard (the Air Quality
Strategy objective is no more than
10 exceedences per year)
Strongly influenced by photochemical
episodes and to a lesser extent by the
magnitude of local NO x emissions
Number of days with daily
maximum of running 8-h
mean exceeding 120 mg m
À3
Equates to the number of exceedences of
the EU Target Value (no more than
25 days, averaged over 3 years) and
Long-Term Objective (no exceedences)
from the third Daughter Directive
Strongly influenced by photochemical
episodes and to a lesser extent by the
magnitude of local NO x emissions
SOMO35 (sum of means over
35 ppb)
Used as a metric by IIASA, for Clean Air
for Europe (CAFE) and NECD revision,
related to annual average of the daily
maximum of the running 8-h mean with
a 70 mg m
À3 cutoff
Influenced by the magnitude of local
NO x emissions and by photochemical
episodes
Regional Air Quality
367
focus is on trade-offs between different scenarios.
While there are win-win situations where policy
will improve both air quality and reduce greenhouse gas emissions, many measures may not
result in such co-benefits. As stated in the IPCC
Fourth Assessment Report “Future climate
change may cause significant air quality degradation by changing the dispersion rate of pollutants,
the chemical environment for ozone and aerosol
generation and the strength of emissions from the
biosphere, fires, and dust. The sign and magnitude
of these effects are highly uncertain and will vary
regionally” [74]. Ozone and aerosols are the two
air pollutants of greatest concern for public health
[75], while being key players in climate change
and feedbacks [36, 76].
Air pollution and greenhouse gases often have
common sources of emission. In addition to the
common sources, there are some gases which are
both air pollutants and act as greenhouse gases,
such as ozone [77]. To best address both issues, a
significant effort will need to be made to understand the impact of a changing climate on air
quality and vice versa. Current work with global
and regional models that couple chemical transport and general circulation simulations have
found that climate change alone could increase
Regional Air Quality, Table 2 A sample of ozone metrics of relevance to human health. (Reproduced from AQEG
2009)
Metric
Relevance
Key influences on the values of this
metric at urban locations
Annual average
Basic metric used to show long-term
trends
Includes all of the hours in the year.
Strongly influenced by the magnitude of
local NO x emissions and by topography
through nocturnal depletion
Annual average of the daily
maximum of the running 8-h
mean
Used as “basic metric” for many of the
health metrics.
Strongly influenced by the magnitude of
local NO x emissions
Annual average of the daily
maximum of the running 8-h
mean with a 70 mg m
À3 cutoff
Health impact, related to SOMO35
Influenced by the magnitude of local
NO x emissions and by photochemical
episodes
Annual average of the daily
maximum of the running 8-h
mean with a 100 mg m
À3 cutoff
Health impact
Strongly influenced by photochemical
episodes and to a lesser extent by the
magnitude of local NO x emissions
Maximum 1-h average (peak
hour in the year)
Used as the basis for some
epidemiological studies, although it has
been suggested that the 8-h metric is
more representative
Also an indicator of short-term peaks,
but note low statistical power, since it is
the value for one single hour
The metric most sensitive to the
magnitude of regionally generated
photochemical episodes and thus likely
to show a response to reductions in
relevant precursor emissions
Number of days with daily
maximum of running 8-h
mean exceeding 100 mg m
À3
Equates to the number of exceedences of
the UK ozone standard (the Air Quality
Strategy objective is no more than
10 exceedences per year)
Strongly influenced by photochemical
episodes and to a lesser extent by the
magnitude of local NO x emissions
Number of days with daily
maximum of running 8-h
mean exceeding 120 mg m
À3
Equates to the number of exceedences of
the EU Target Value (no more than
25 days, averaged over 3 years) and
Long-Term Objective (no exceedences)
from the third Daughter Directive
Strongly influenced by photochemical
episodes and to a lesser extent by the
magnitude of local NO x emissions
SOMO35 (sum of means over
35 ppb)
Used as a metric by IIASA, for Clean Air
for Europe (CAFE) and NECD revision,
related to annual average of the daily
maximum of the running 8-h mean with
a 70 mg m
À3 cutoff
Influenced by the magnitude of local
NO x emissions and by photochemical
episodes
Regional Air Quality
367