

Metrics also exist to quantify health or environmental effects of air pollutants, with different metrics established for human health and the
environment. For example, AOT40 is the accumulated exposure over a threshold of 40 ppbV during
daylight hours for a relevant period. SOMO35 is the
sum of the daily maximum of running 8-h means
over 35 ppbV. Both the AOT40 and SOMO35 are
ozone metrics. Metrics such as AOT40 and
SOMO35 are frequently considered to be more
appropriate measures of the effects of ozone on
crops and vegetation than those metrics designed
to protect human health. A sample of environmental
and health metrics are given in Table 2 [70].
Regional Context
There are a variety of spatial scales that both influence air quality and that air quality impact, such as
the local, regional, and global. It is clear that these
scales are not independent and definitions are
loose. The local scale tends to the anthropogenic
emission/human influence scale encompassing a
city or a smaller area within a city, while regional
scales are typically larger, encompassing an entire
metropolitan region and the surrounding area or
even greater. An example of a regional scale
could be London and southeast England, or it
could also be as large as all of Europe, depending
on how the user defines it. When considering air
quality on any regional scale, secondary pollutants
from atmospheric processing and the transport of
pollutants become much more important and primary emissions less so.
For example, as discussed earlier, ozone is an
important secondary pollutant, which because of
atmospheric processing time, has significant implications for regional air quality. Plume transport for
urban areas into the surrounding region can have a
significant influence on the air quality in the surrounding region [71]. In many cases, ozone concentrations have been observed to be higher in rural
areas than urban areas [72, 73]. Furthermore, since
regional air quality frequently includes rural areas,
and thereby areas with fewer primary anthropogenic emissions, natural emissions can play a
more significant role. For example, biogenic
VOCs, such as isoprene, can contribute to ozone
and other secondary pollutant formation, and wind
erosion can add soil and/or dust to the existing
aerosol loading. While these factors can and do
also exist on a local scale, their relative importance
on a local or regional scale varies depending on the
location and size of the areas chosen.
Future Directions
Air Quality and Climate
Air quality and climate change are important
issues with complex interactions (see Figs. 1 and
17). Both are environmental issues that are and
will continue to be addressed by environmental
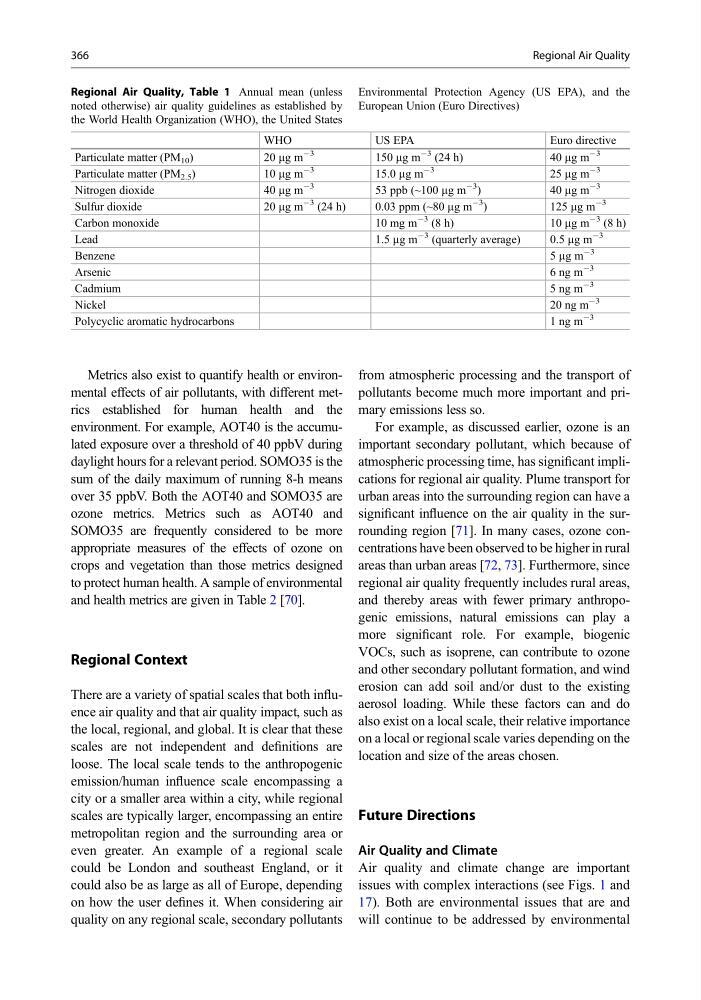
Regional Air Quality, Table 1 Annual mean (unless
noted otherwise) air quality guidelines as established by
the World Health Organization (WHO), the United States
Environmental Protection Agency (US EPA), and the
European Union (Euro Directives)
WHO
US EPA
Euro directive
Particulate matter (PM 10 )
2 0 mg m
À3
150 mg m
À3 (24 h)
40 mg m
À3
Particulate matter (PM 2.5 )
1 0 mg m
À3
15.0 mg m
À3
25 mg m
À3
Nitrogen dioxide
40 mg m
À3
53 ppb (~100 mg m
À3
)
4 0 mg m
À3
Sulfur dioxide
20 mg m
À3 (24 h)
0.03 ppm (~80 mg m
À3
)
125 mg m
À3
Carbon monoxide
10 mg m
À3 (8 h)
10 mg m
À3 (8 h)
Lead
1.5 mg m
À3 (quarterly average)
0.5 mg m
À3
Benzene
5 mg m
À3
Arsenic
6 ng m
À3
Cadmium
5 ng m
À3
Nickel
20 ng m
À3
Polycyclic aromatic hydrocarbons
1 ng m
À3
366
Regional Air Quality
environment. For example, AOT40 is the accumulated exposure over a threshold of 40 ppbV during
daylight hours for a relevant period. SOMO35 is the
sum of the daily maximum of running 8-h means
over 35 ppbV. Both the AOT40 and SOMO35 are
ozone metrics. Metrics such as AOT40 and
SOMO35 are frequently considered to be more
appropriate measures of the effects of ozone on
crops and vegetation than those metrics designed
to protect human health. A sample of environmental
and health metrics are given in Table 2 [70].
Regional Context
There are a variety of spatial scales that both influence air quality and that air quality impact, such as
the local, regional, and global. It is clear that these
scales are not independent and definitions are
loose. The local scale tends to the anthropogenic
emission/human influence scale encompassing a
city or a smaller area within a city, while regional
scales are typically larger, encompassing an entire
metropolitan region and the surrounding area or
even greater. An example of a regional scale
could be London and southeast England, or it
could also be as large as all of Europe, depending
on how the user defines it. When considering air
quality on any regional scale, secondary pollutants
from atmospheric processing and the transport of
pollutants become much more important and primary emissions less so.
For example, as discussed earlier, ozone is an
important secondary pollutant, which because of
atmospheric processing time, has significant implications for regional air quality. Plume transport for
urban areas into the surrounding region can have a
significant influence on the air quality in the surrounding region [71]. In many cases, ozone concentrations have been observed to be higher in rural
areas than urban areas [72, 73]. Furthermore, since
regional air quality frequently includes rural areas,
and thereby areas with fewer primary anthropogenic emissions, natural emissions can play a
more significant role. For example, biogenic
VOCs, such as isoprene, can contribute to ozone
and other secondary pollutant formation, and wind
erosion can add soil and/or dust to the existing
aerosol loading. While these factors can and do
also exist on a local scale, their relative importance
on a local or regional scale varies depending on the
location and size of the areas chosen.
Future Directions
Air Quality and Climate
Air quality and climate change are important
issues with complex interactions (see Figs. 1 and
17). Both are environmental issues that are and
will continue to be addressed by environmental
Regional Air Quality, Table 1 Annual mean (unless
noted otherwise) air quality guidelines as established by
the World Health Organization (WHO), the United States
Environmental Protection Agency (US EPA), and the
European Union (Euro Directives)
WHO
US EPA
Euro directive
Particulate matter (PM 10 )
2 0 mg m
À3
150 mg m
À3 (24 h)
40 mg m
À3
Particulate matter (PM 2.5 )
1 0 mg m
À3
15.0 mg m
À3
25 mg m
À3
Nitrogen dioxide
40 mg m
À3
53 ppb (~100 mg m
À3
)
4 0 mg m
À3
Sulfur dioxide
20 mg m
À3 (24 h)
0.03 ppm (~80 mg m
À3
)
125 mg m
À3
Carbon monoxide
10 mg m
À3 (8 h)
10 mg m
À3 (8 h)
Lead
1.5 mg m
À3 (quarterly average)
0.5 mg m
À3
Benzene
5 mg m
À3
Arsenic
6 ng m
À3
Cadmium
5 ng m
À3
Nickel
20 ng m
À3
Polycyclic aromatic hydrocarbons
1 ng m
À3
366
Regional Air Quality