

Statistical Models
Statistical models are empirical or semiempirical
models based on the statistical analysis of measured
data. Instead of following the evolution of emissions
in the atmosphere, statistical models work backward, from measured data collected at a given location, a receptor site, and work out the responsible
emission sources. These models are also frequently
referred to as receptor models. There are a number
of different approaches that are used based on the
understanding of source–receptor relationships
including the chemical mass balance (CMB)
model, which requires complete knowledge of
sources and results in a quantitative output of source
contributions and uncertainties, and factor analysis
methods, such as Principal Component Analysis
(PCA), which require no a priori source information.
The different types of receptor models and the
amount of knowledge required for model use is
summarized in Fig. 15 [63, 64].
Chemical mass balance models are frequently
used to support air quality decision-making for
policy, such as was the case for CMB studies in
Los Angeles, CA, and Las Vegas, NV which were
used for the creation of State Implementation
Plans to attain PM 10 requirements [65]. In addition, CMB can be used to assess the success of
implemented control technologies, and which
sources are potentials for reduction controls.
Such applications are possible in that CMB results
yield quantitative source contributions to the measured metric, i.e., PM 2.5 , organic carbon, or total
mass. From such results the sources with the largest contributions can be targeted for reduction, or
changes in specific source contributions assessed.
Recent reviews of CMB and other receptor
models found that for the studies analyzed (the
majority of which were from measurements in the
USA and Europe), fossil fuel combustion is an
important contributor to PM concentrations, with
the primary contributions stemming from gasoline
and diesel vehicle exhaust [64, 65]. Stationary
sources, such as power stations, have only minimal source contributions when the facilities have
effective pollution controls in place, but can be
large contributors without such control technologies [65]. An example of the type of result produced by CMB modeling where fine-particulate
matter organic carbon mass is apportioned is
shown in Fig. 16 for West Jerusalem in 2007 [66].
30
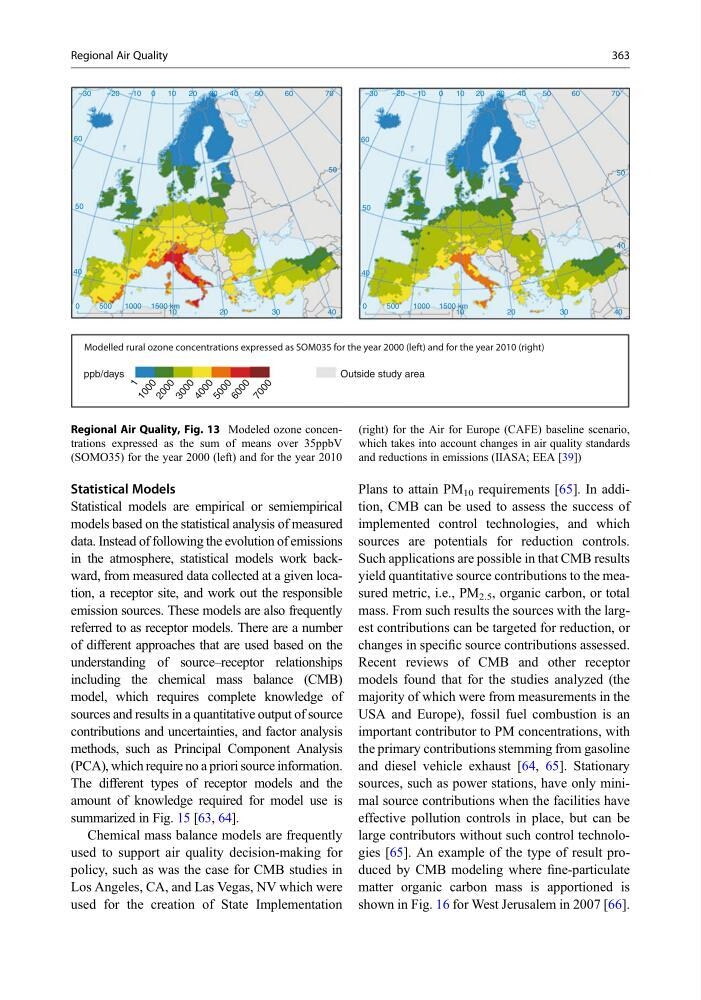
Modelled rural ozone concentrations expressed as SOM035 for the year 2000 (left) and for the year 2010 (right)
Outside study area
ppb/days
1
1 0 0 0
2 0 0 0
3 0 0 0
4 0 0 0
5 0 0 0
6 0 0 0
7 0 0 0
20
40
50
60
–30
–20 –10 0
10
20
30
40
50
60
70
–30
–20 –10
0
10
20
30
40
50
60
70
60
50
50
50
40
40
40
40
10
30
20
10
1500 km
1000
500
0
1500 km
1000
500
0
Regional Air Quality, Fig. 13 Modeled ozone concentrations expressed as the sum of means over 35ppbV
(SOMO35) for the year 2000 (left) and for the year 2010
(right) for the Air for Europe (CAFE) baseline scenario,
which takes into account changes in air quality standards
and reductions in emissions (IIASA; EEA [39])
Regional Air Quality
363
Statistical models are empirical or semiempirical
models based on the statistical analysis of measured
data. Instead of following the evolution of emissions
in the atmosphere, statistical models work backward, from measured data collected at a given location, a receptor site, and work out the responsible
emission sources. These models are also frequently
referred to as receptor models. There are a number
of different approaches that are used based on the
understanding of source–receptor relationships
including the chemical mass balance (CMB)
model, which requires complete knowledge of
sources and results in a quantitative output of source
contributions and uncertainties, and factor analysis
methods, such as Principal Component Analysis
(PCA), which require no a priori source information.
The different types of receptor models and the
amount of knowledge required for model use is
summarized in Fig. 15 [63, 64].
Chemical mass balance models are frequently
used to support air quality decision-making for
policy, such as was the case for CMB studies in
Los Angeles, CA, and Las Vegas, NV which were
used for the creation of State Implementation
Plans to attain PM 10 requirements [65]. In addition, CMB can be used to assess the success of
implemented control technologies, and which
sources are potentials for reduction controls.
Such applications are possible in that CMB results
yield quantitative source contributions to the measured metric, i.e., PM 2.5 , organic carbon, or total
mass. From such results the sources with the largest contributions can be targeted for reduction, or
changes in specific source contributions assessed.
Recent reviews of CMB and other receptor
models found that for the studies analyzed (the
majority of which were from measurements in the
USA and Europe), fossil fuel combustion is an
important contributor to PM concentrations, with
the primary contributions stemming from gasoline
and diesel vehicle exhaust [64, 65]. Stationary
sources, such as power stations, have only minimal source contributions when the facilities have
effective pollution controls in place, but can be
large contributors without such control technologies [65]. An example of the type of result produced by CMB modeling where fine-particulate
matter organic carbon mass is apportioned is
shown in Fig. 16 for West Jerusalem in 2007 [66].
30
Modelled rural ozone concentrations expressed as SOM035 for the year 2000 (left) and for the year 2010 (right)
Outside study area
ppb/days
1
1 0 0 0
2 0 0 0
3 0 0 0
4 0 0 0
5 0 0 0
6 0 0 0
7 0 0 0
20
40
50
60
–30
–20 –10 0
10
20
30
40
50
60
70
–30
–20 –10
0
10
20
30
40
50
60
70
60
50
50
50
40
40
40
40
10
30
20
10
1500 km
1000
500
0
1500 km
1000
500
0
Regional Air Quality, Fig. 13 Modeled ozone concentrations expressed as the sum of means over 35ppbV
(SOMO35) for the year 2000 (left) and for the year 2010
(right) for the Air for Europe (CAFE) baseline scenario,
which takes into account changes in air quality standards
and reductions in emissions (IIASA; EEA [39])
Regional Air Quality
363