

exposure studies have documented the association between aerosols and adverse health effects
[18, 38, 57]. Health effects can range from eye
irritation to cardiovascular system related mortality. The Harvard Six Cities study was a cohort
study which estimated the effects of air pollution
on mortality, while also controlling for other
individual risk factors, such as smoking
[58]. Over 8,000 adults in six US cities were
included in the study that lasted approximately
15 years. Statistically significant associations
were found between air pollution and mortality
with positive associations between air pollution
and death from lung cancer, as well as air pollution and cardiopulmonary disease. The air pollutants most associated with the mortality were
fine particulates and sulfate [58]. A later cohort
study from 1982 to 1989 using data from 151 US
cities and over 550,000 adults found that
increased mortality was associated with sulfate
and fine-particulate air pollution and that particulate air pollution was linked with cardiopulmonary and lung cancer mortality, very similar to
the Six City study findings [59]. Later studies and
reanalysis of the data found that there was no
consistent toxicological evidence to suggest that
long-term exposure to sulfates had significant
effects on the cardiovascular system [60]. The
association of sulfate with adverse health effects
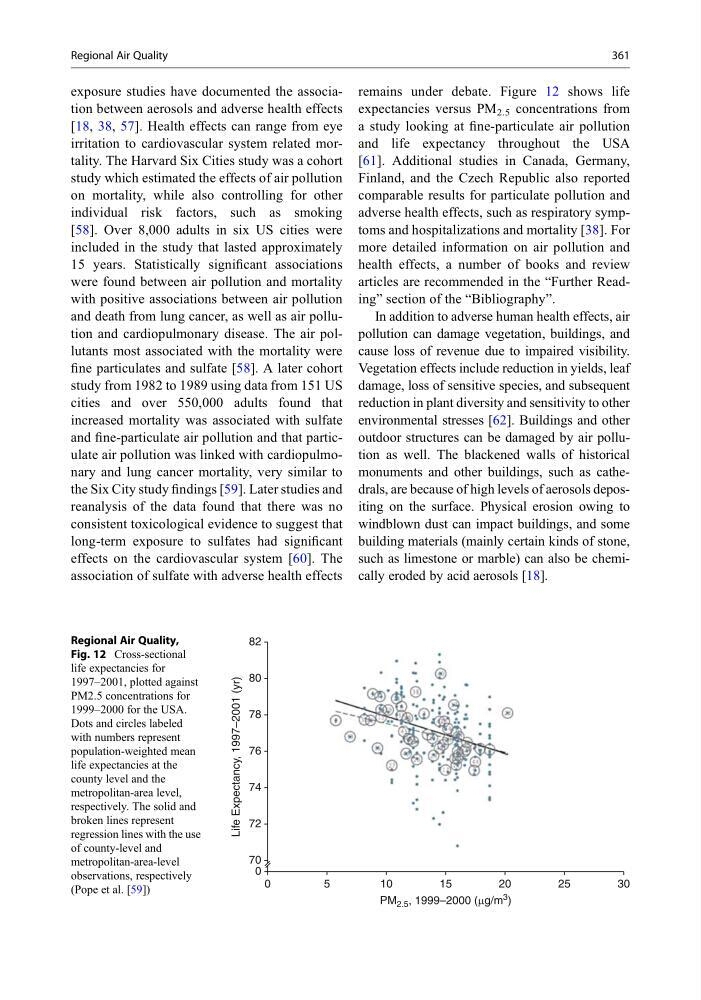
remains under debate. Figure 12 shows life
expectancies versus PM 2.5 concentrations from
a study looking at fine-particulate air pollution
and life expectancy throughout the USA
[61]. Additional studies in Canada, Germany,
Finland, and the Czech Republic also reported
comparable results for particulate pollution and
adverse health effects, such as respiratory symptoms and hospitalizations and mortality [38]. For
more detailed information on air pollution and
health effects, a number of books and review
articles are recommended in the “Further Reading” section of the “Bibliography”.
In addition to adverse human health effects, air
pollution can damage vegetation, buildings, and
cause loss of revenue due to impaired visibility.
Vegetation effects include reduction in yields, leaf
damage, loss of sensitive species, and subsequent
reduction in plant diversity and sensitivity to other
environmental stresses [62]. Buildings and other
outdoor structures can be damaged by air pollution as well. The blackened walls of historical
monuments and other buildings, such as cathedrals, are because of high levels of aerosols depositing on the surface. Physical erosion owing to
windblown dust can impact buildings, and some
building materials (mainly certain kinds of stone,
such as limestone or marble) can also be chemically eroded by acid aerosols [18].
0
0
70
72
74
Life Expectancy, 1997–2001 (yr)
76
78
80
82
5
1 0
1 5
PM 2.5 , 1999–2000 (μg/m
3 )
20
25
30
Regional Air Quality,
Fig. 12 Cross-sectional
life expectancies for
1997–2001, plotted against
PM2.5 concentrations for
1999–2000 for the USA.
Dots and circles labeled
with numbers represent
population-weighted mean
life expectancies at the
county level and the
metropolitan-area level,
respectively. The solid and
broken lines represent
regression lines with the use
of county-level and
metropolitan-area-level
observations, respectively
(Pope et al. [59])
Regional Air Quality
361
[18, 38, 57]. Health effects can range from eye
irritation to cardiovascular system related mortality. The Harvard Six Cities study was a cohort
study which estimated the effects of air pollution
on mortality, while also controlling for other
individual risk factors, such as smoking
[58]. Over 8,000 adults in six US cities were
included in the study that lasted approximately
15 years. Statistically significant associations
were found between air pollution and mortality
with positive associations between air pollution
and death from lung cancer, as well as air pollution and cardiopulmonary disease. The air pollutants most associated with the mortality were
fine particulates and sulfate [58]. A later cohort
study from 1982 to 1989 using data from 151 US
cities and over 550,000 adults found that
increased mortality was associated with sulfate
and fine-particulate air pollution and that particulate air pollution was linked with cardiopulmonary and lung cancer mortality, very similar to
the Six City study findings [59]. Later studies and
reanalysis of the data found that there was no
consistent toxicological evidence to suggest that
long-term exposure to sulfates had significant
effects on the cardiovascular system [60]. The
association of sulfate with adverse health effects
remains under debate. Figure 12 shows life
expectancies versus PM 2.5 concentrations from
a study looking at fine-particulate air pollution
and life expectancy throughout the USA
[61]. Additional studies in Canada, Germany,
Finland, and the Czech Republic also reported
comparable results for particulate pollution and
adverse health effects, such as respiratory symptoms and hospitalizations and mortality [38]. For
more detailed information on air pollution and
health effects, a number of books and review
articles are recommended in the “Further Reading” section of the “Bibliography”.
In addition to adverse human health effects, air
pollution can damage vegetation, buildings, and
cause loss of revenue due to impaired visibility.
Vegetation effects include reduction in yields, leaf
damage, loss of sensitive species, and subsequent
reduction in plant diversity and sensitivity to other
environmental stresses [62]. Buildings and other
outdoor structures can be damaged by air pollution as well. The blackened walls of historical
monuments and other buildings, such as cathedrals, are because of high levels of aerosols depositing on the surface. Physical erosion owing to
windblown dust can impact buildings, and some
building materials (mainly certain kinds of stone,
such as limestone or marble) can also be chemically eroded by acid aerosols [18].
0
0
70
72
74
Life Expectancy, 1997–2001 (yr)
76
78
80
82
5
1 0
1 5
PM 2.5 , 1999–2000 (μg/m
3 )
20
25
30
Regional Air Quality,
Fig. 12 Cross-sectional
life expectancies for
1997–2001, plotted against
PM2.5 concentrations for
1999–2000 for the USA.
Dots and circles labeled
with numbers represent
population-weighted mean
life expectancies at the
county level and the
metropolitan-area level,
respectively. The solid and
broken lines represent
regression lines with the use
of county-level and
metropolitan-area-level
observations, respectively
(Pope et al. [59])
Regional Air Quality
361